
The 2024 Arctic sea ice melting season is very likely at an end, with both of the main coverage measures – extent and area – trending upward during the past week.
According to NSIDC, 2024’s sea ice extent minimum was likely set on 11th September, at 4.28 million square km, which is 7th lowest in the satellite record.
Meanwhile, the 5-day trailing average of sea ice area’s minimum, set 5th September, was 3rd lowest on record at 2.483 million square km, just above 2016 (2.476) and well above 2012 (2.220).
While these are high rankings, we’ve made it through another melting season without the coverage plunging well below the range we’ve seen during the past decade. Yet I have found this season very disturbing – read on for a monthly breakdown that reveals the source of my concern.
May
Below, I have created composites of sea-level pressure for the Mays of 1978-2021 with the largest (left) and smallest (centre) losses of sea ice area, along with the one for May 2024 (right). This layout will be repeated for each calendar month.
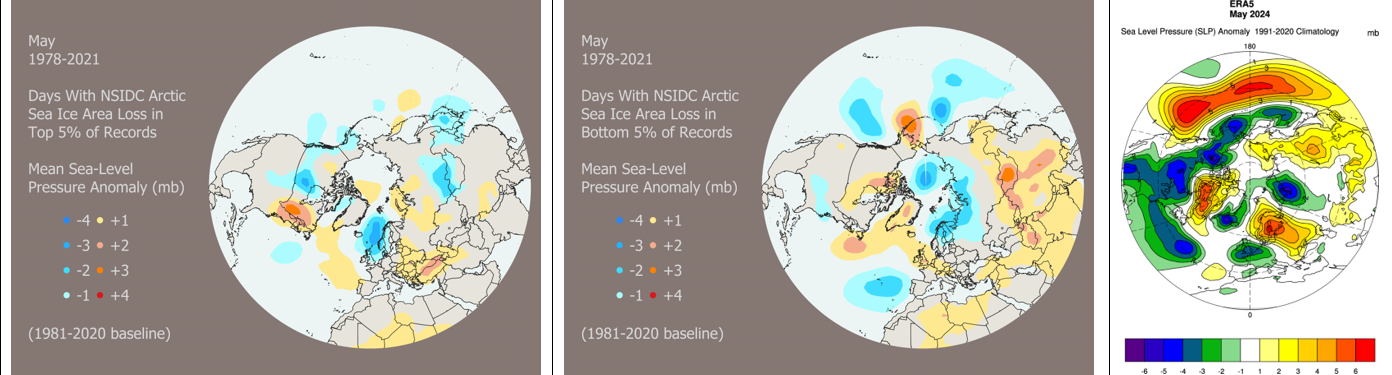
This month is when we usually see some important ‘preconditioning’ for the melting season. Increasing air temperatures and strength of sunshine lead to melting of the sea ice surface, the meltwater then collecting into ‘melt ponds’. These have lower albedo than bare ice, meaning they don’t reflect as much sunlight, making them a big deal during the peak sunshine intensity months of June and July.
May 2024 saw a very mixed sea-level pressure pattern across the Arctic, weakly resembling the composite for high sea ice area losses in some regions, but low losses in others. The observed loss was unremarkable, ranking 21st largest for extent and 26th for area. A very unassuming start for what would prove to be a strong melting season.
June
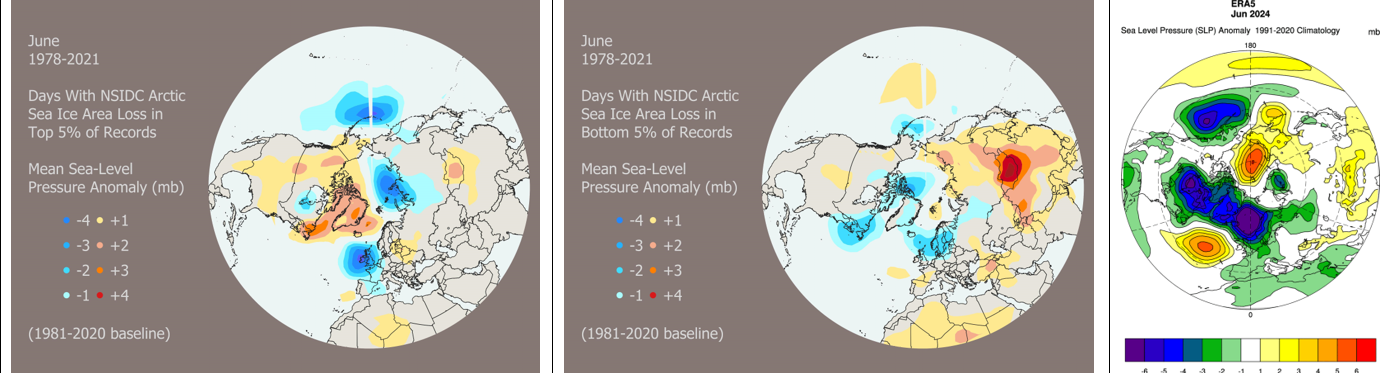
In June, the sun hits peak and for the local sea ice, it matters a great deal how clear the weather is over the Arctic Ocean – especially if May has created a lot of melt ponds. Interestingly, the high losses composite reveals that this is mainly true for Greenland and the American side of the Arctic.
2024 had other ideas. With anomalously low pressure spanning Canada to Scandinavia via Greenland, and higher than usual pressure over north-eastern Asia, June’s mean weather pattern was quite close to the composite for the years with sea ice area loss in the lowest 5%.
Despite this, the melting of sea ice was much greater than May’s with respect to the historical range, ranking 11th largest for extent and 6th for area.
How can this be? Well, by some measures it was the warmest June on record for the Arctic Ocean (by others, very close to that) in terms of the airmasses moving over the sea ice (using 850 hPa pressure level temperatures as a proxy). This allowed for substantial melting despite a shortage of very conducive weather patterns.
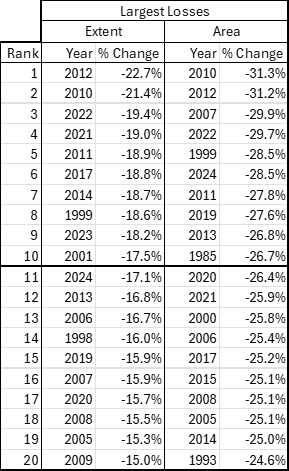
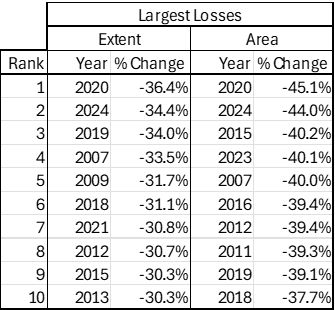
The following month proved to be brutal for the Arctic sea ice, with the 2nd largest percentage loss on record for each of extent and area
July
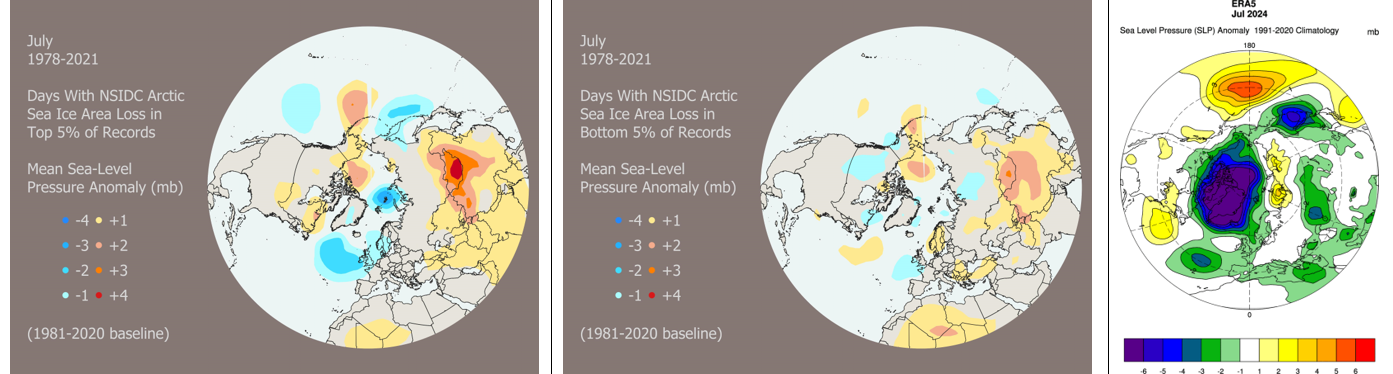
We can see in the composites that there isn’t much distinction between years with the largest and smallest losses. The implication being that other factors play a more important role during this month.
However, 2024 may well have been an exception to this, as it featured one of the most extreme sea-level pressure patterns ever recorded in this calendar month: a huge negative sea-level pressure anomaly over and around Greenland.
Anomalously high airmass temperatures remained a factor too, ranking 6th highest at the 850 hPa pressure level.
This relatively warm and wild combination was clearly very damaging to the Arctic sea ice, representing a high-loss combination that’s rarely been seen before in the satellite record (and likely a lot further back in time).
August
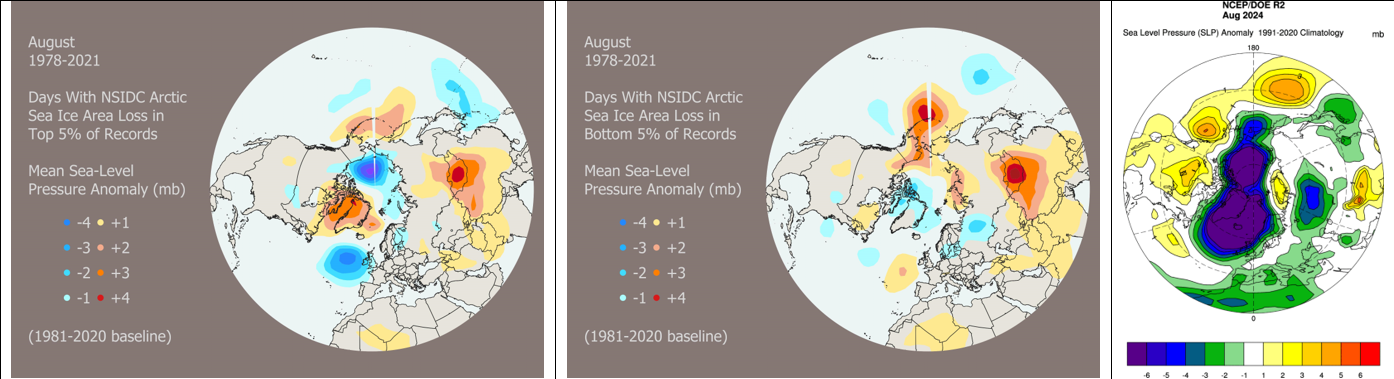
In August, a ‘dipole’ pattern of anomalously high pressure around Greenland and low pressure over the Beaufort Sea (Pacific side of Arctic Ocean) has historically produced the largest percentage losses of Arctic sea ice area. Meanwhile, the opposite pattern has produced the smallest losses.
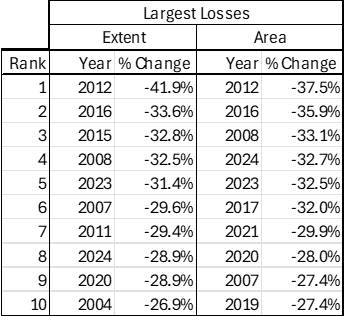
In 2024, the month simply decided to go with unusually low pressure everywhere. An unusual pattern, with a lot in common to July’s, but seemingly not as destructive, with losses ranking 8th largest for extent and 4th for area. Not that those are low rankings, far from it.
A Hard-Hitting Melting Season
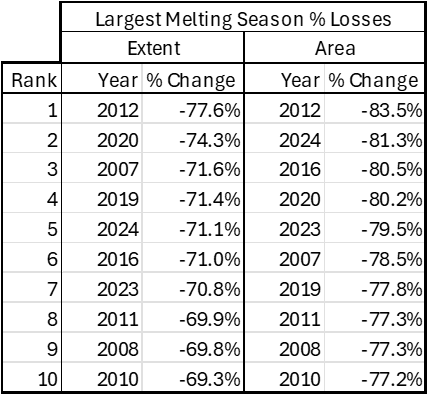
Overall, 2024’s melting season has provisionally seen a 72.5% reduction in sea ice extent, and 81.3% reduction in sea ice area, since their respective annual maximums. These are some serious numbers, amounting to 5th & 2nd largest on record (1979-2024), respectively.
Notice something about the years in the top ten? Yep, they’re all in the 21st century. By each measure, all but two are 2010 or later. This alludes to an important characteristic of the long-term trend in Arctic sea ice coverage: The minimums are decreasing more steeply than the maximums.
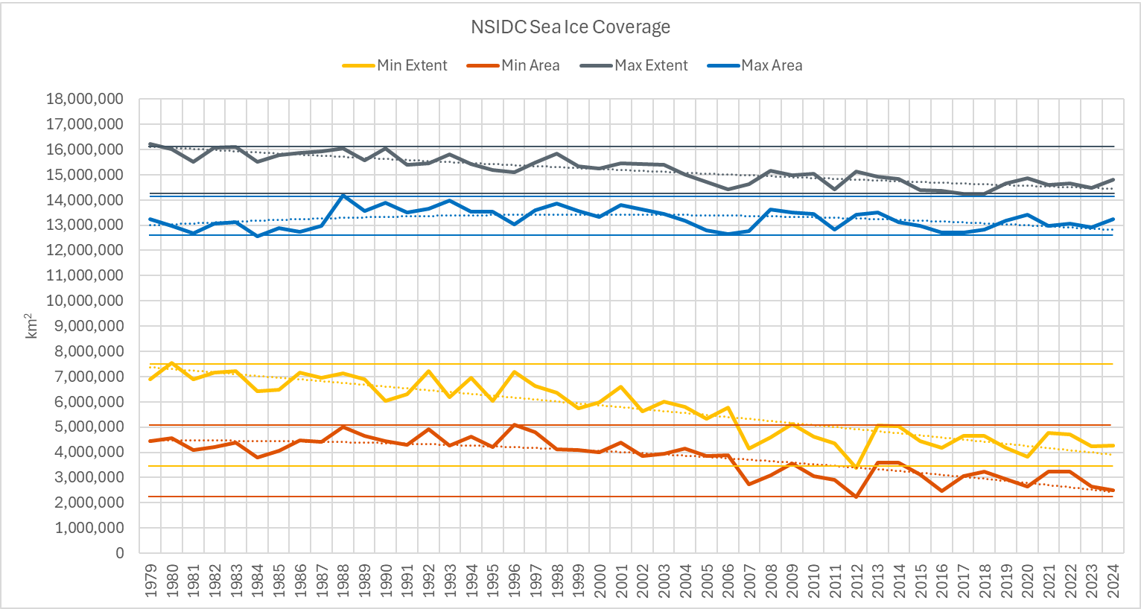
See how the min-max bars are more widely spaced for the annual minimum extent and area versus the maximum. The long-term deterioration of the Arctic sea ice is mainly about a reduced amount surviving the melting season.
So, 2024 is very on-trend with its seriously large reductions from annual maximum. It’s also continued a disturbing decline in coverage of thick, multi-year sea ice. According to the PIOMAS best estimate of sea ice thickness, the thickest ice in mid-September 2024 was constrained to a relatively small area known as the Prince Gustaf Adolf Sea.
Contrast that with 2020 for example, when the minimum extent was 2nd lowest on record. Just 4 years ago, yet there was far more ice at least 2 metres thick, or 3 metres for that matter.
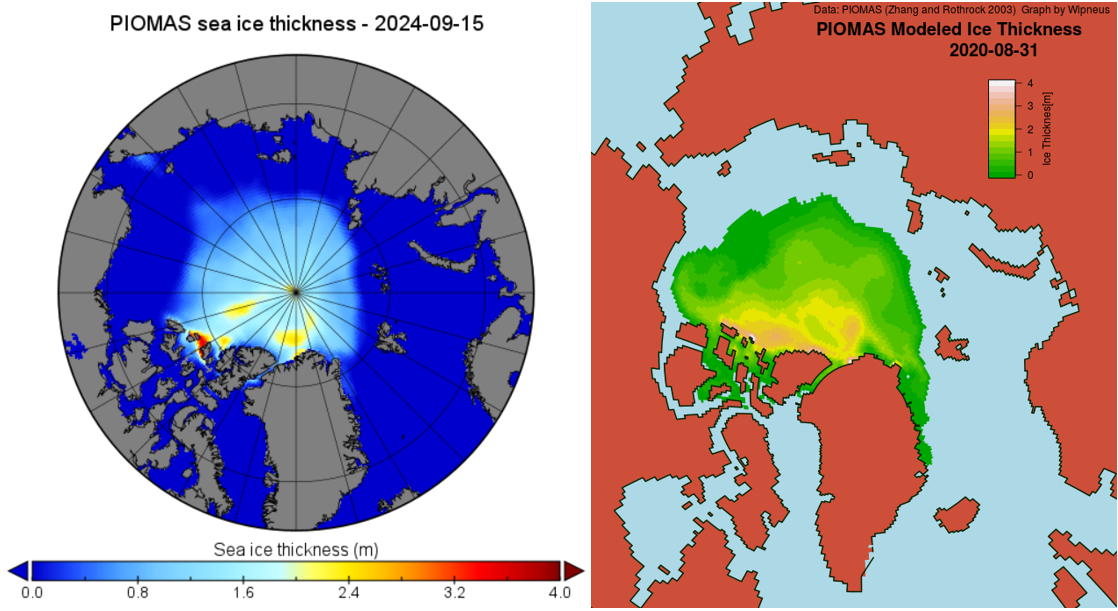
What was once seemingly a bastion for multi-year ice has been reduced to fragments, the thickest of which is in a location vulnerable to export through the channels of the Canadian Archipelago. According to recent research from NASA’s Jet Propulsion Laboratory (southern California), typical autumn sea ice thickness hit a peak at 8.8 feet in 1980, and has since dropped by over 50%, to 4.2 feet.
All said, what really makes this year’s melting season stand out to me is the occurrence of strong sea ice melt despite weather patterns not appearing to have been conducive to that.
Heated Problem
Which is to say, using past years with similar patterns to 2024 as a guide, you wouldn’t expect it to be in the top ten, let alone top two melting seasons for the reduction of area from maximum.
That leaves higher temperatures and reduced resilience of sea ice as the most likely culprits.
At this point, a glaring question floats to the surface: What will happen when both comparably high temperatures and strongly melt-conducive weather patterns coincide?
Honestly, a drop of sea ice coverage to or below 2012’s minimum seems very plausible. Since that shocking season, we’ve arguably not seen such conducive weather patterns reoccur, with 2016 and 2020 coming closest but still diverging at key moments.
What’s more, global mean temperatures have increased significantly since even 2020, the upward trend slightly boosted by the effects of reduced sulphur dioxide emissions in shipping.
So, not only could we see a new record low, but a weaker recovery during subsequent years too, compared to post-2012. What’s currently an outlying, extreme minimum in the time series, will probably become unremarkable within the next few decades.
James Peacock MSc
Head Meteorologist at MetSwift
Featured Photo by Annie Spratt on Unsplash