Having explored some standout predicted wildfire risks in the contiguous US in my last blog, this time we’re casting our eyes well beyond, even to the far side of the planet.
Early to Mid-March in Central-Eastern South America
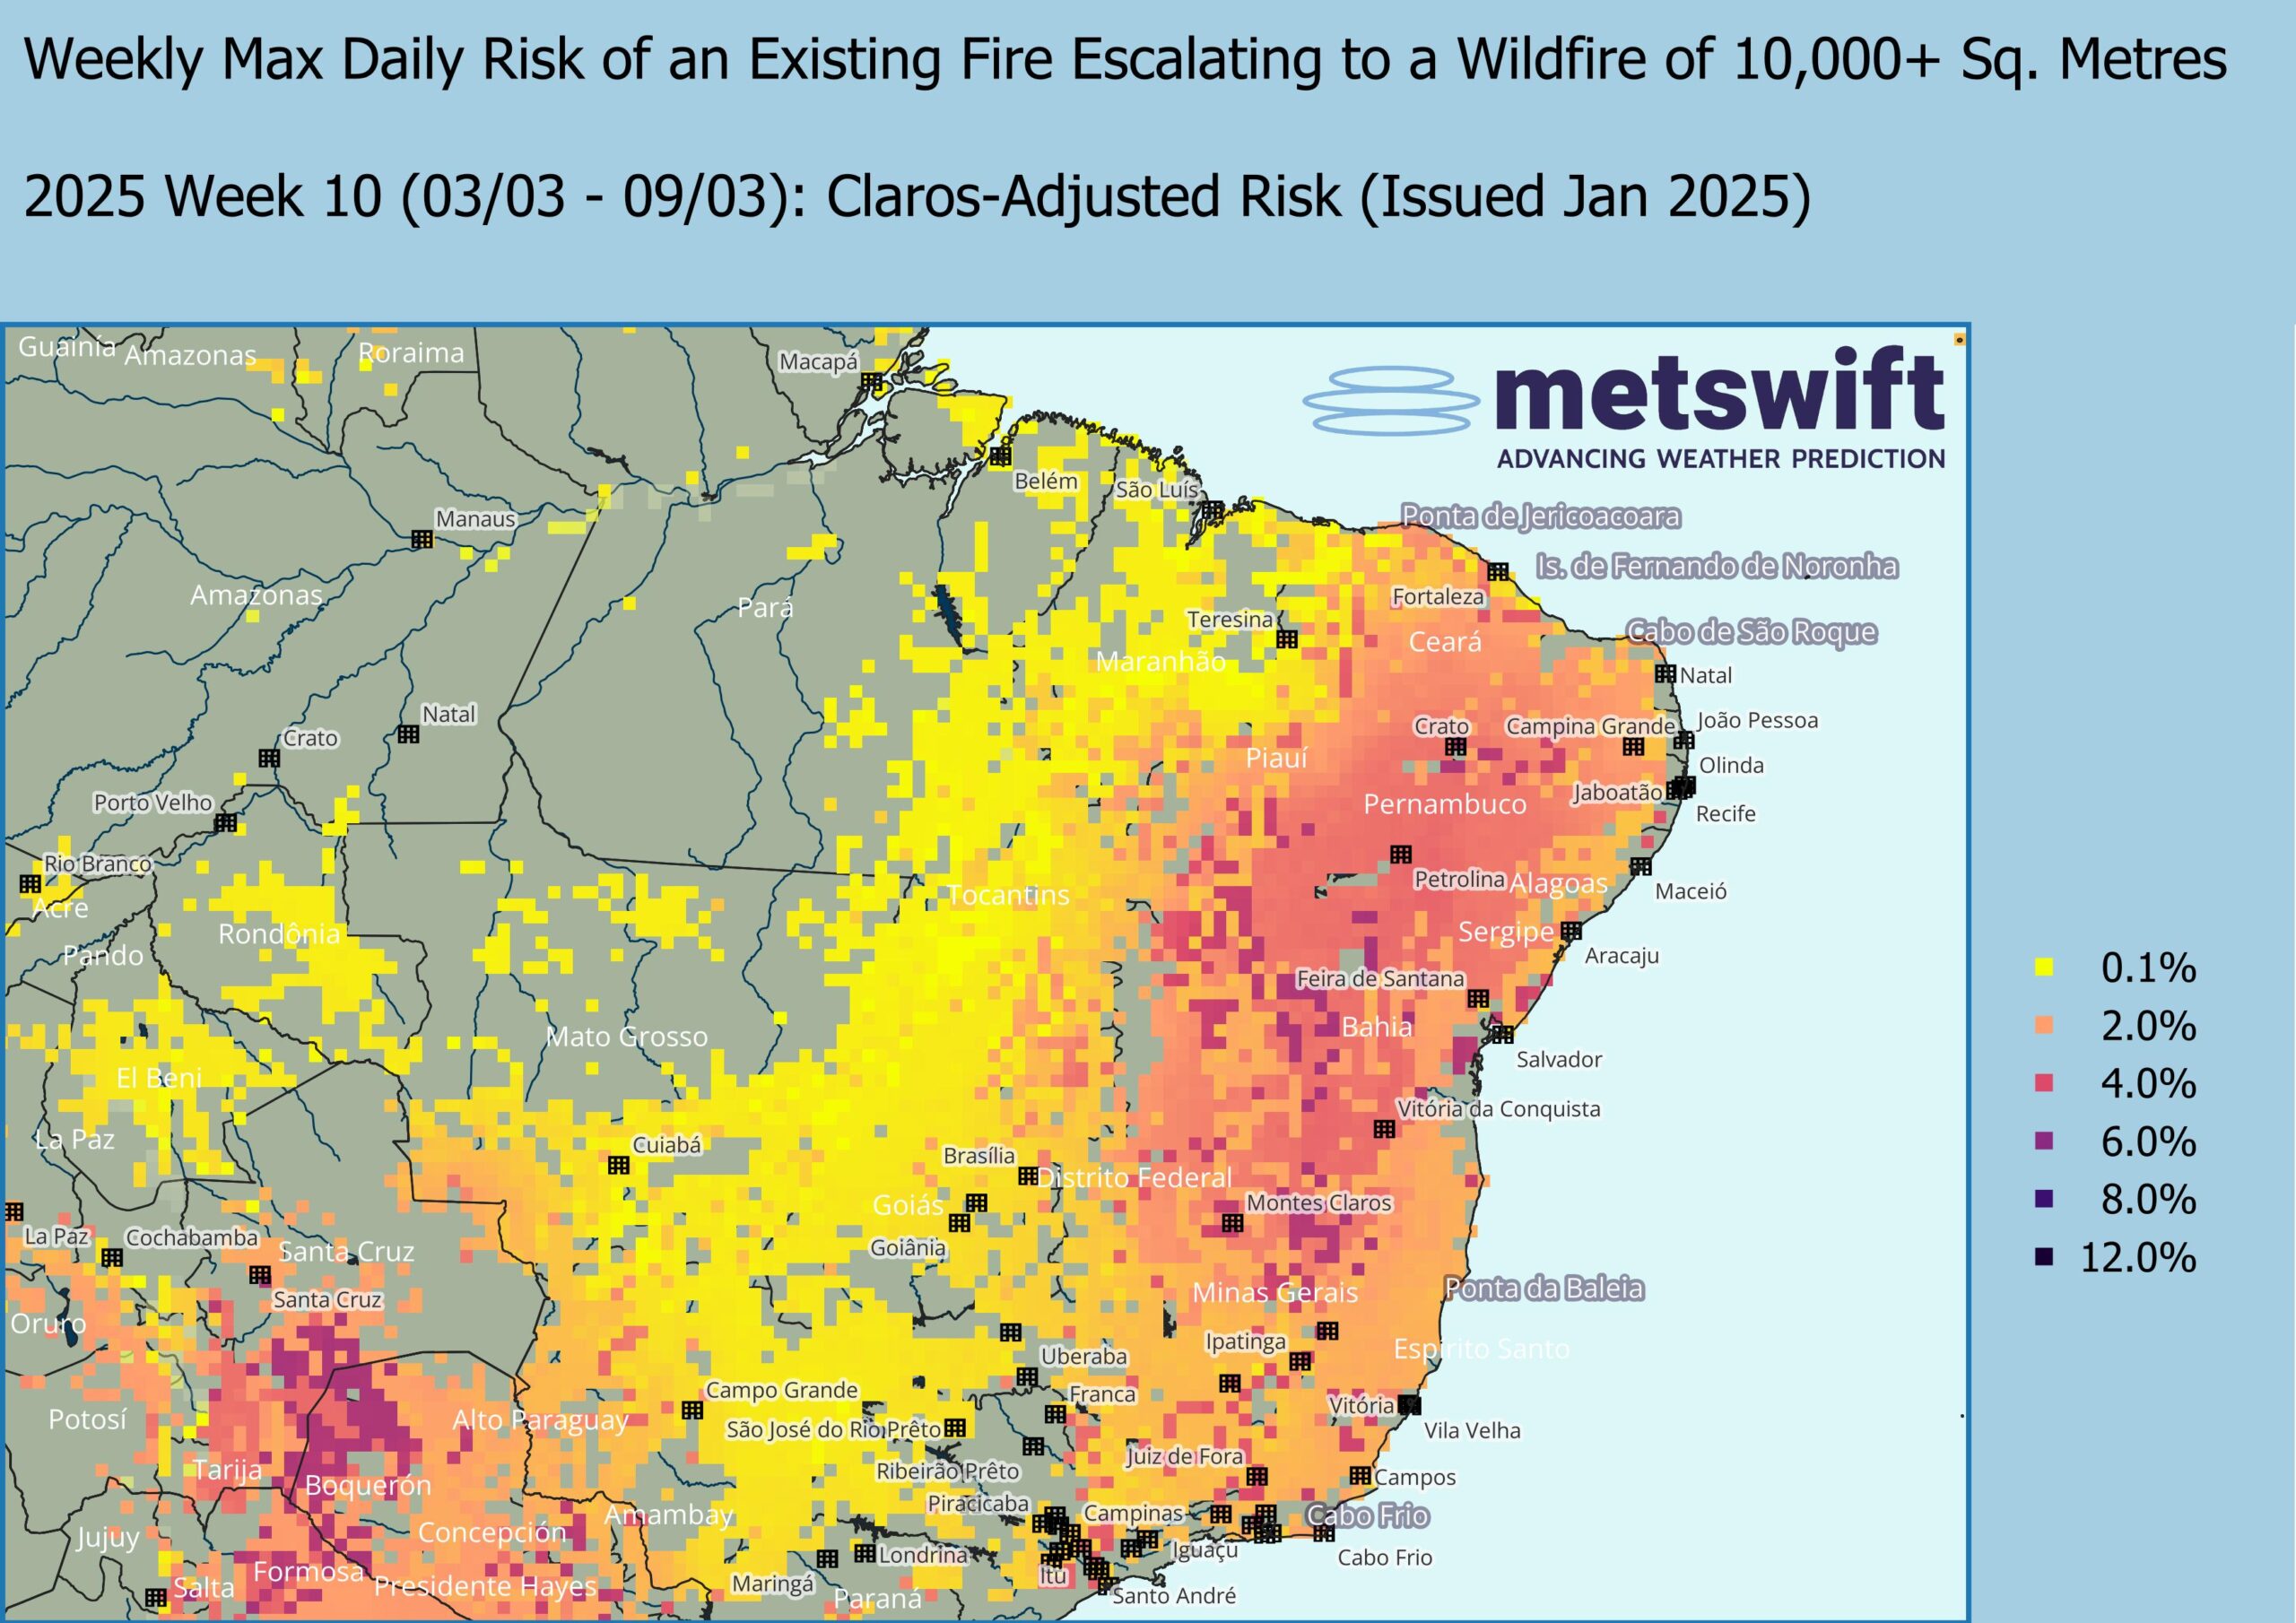
First off, we’re looking mainly at southern and eastern Brazil. Here in early to mid-March, the predicted risk is highest in two areas: the eastern shrublands, and the mixture of shrubland and forests around Santa Cruz, both with a peak close to 6%.
Claros suggests both these areas will bear monitoring around this time in 2025.
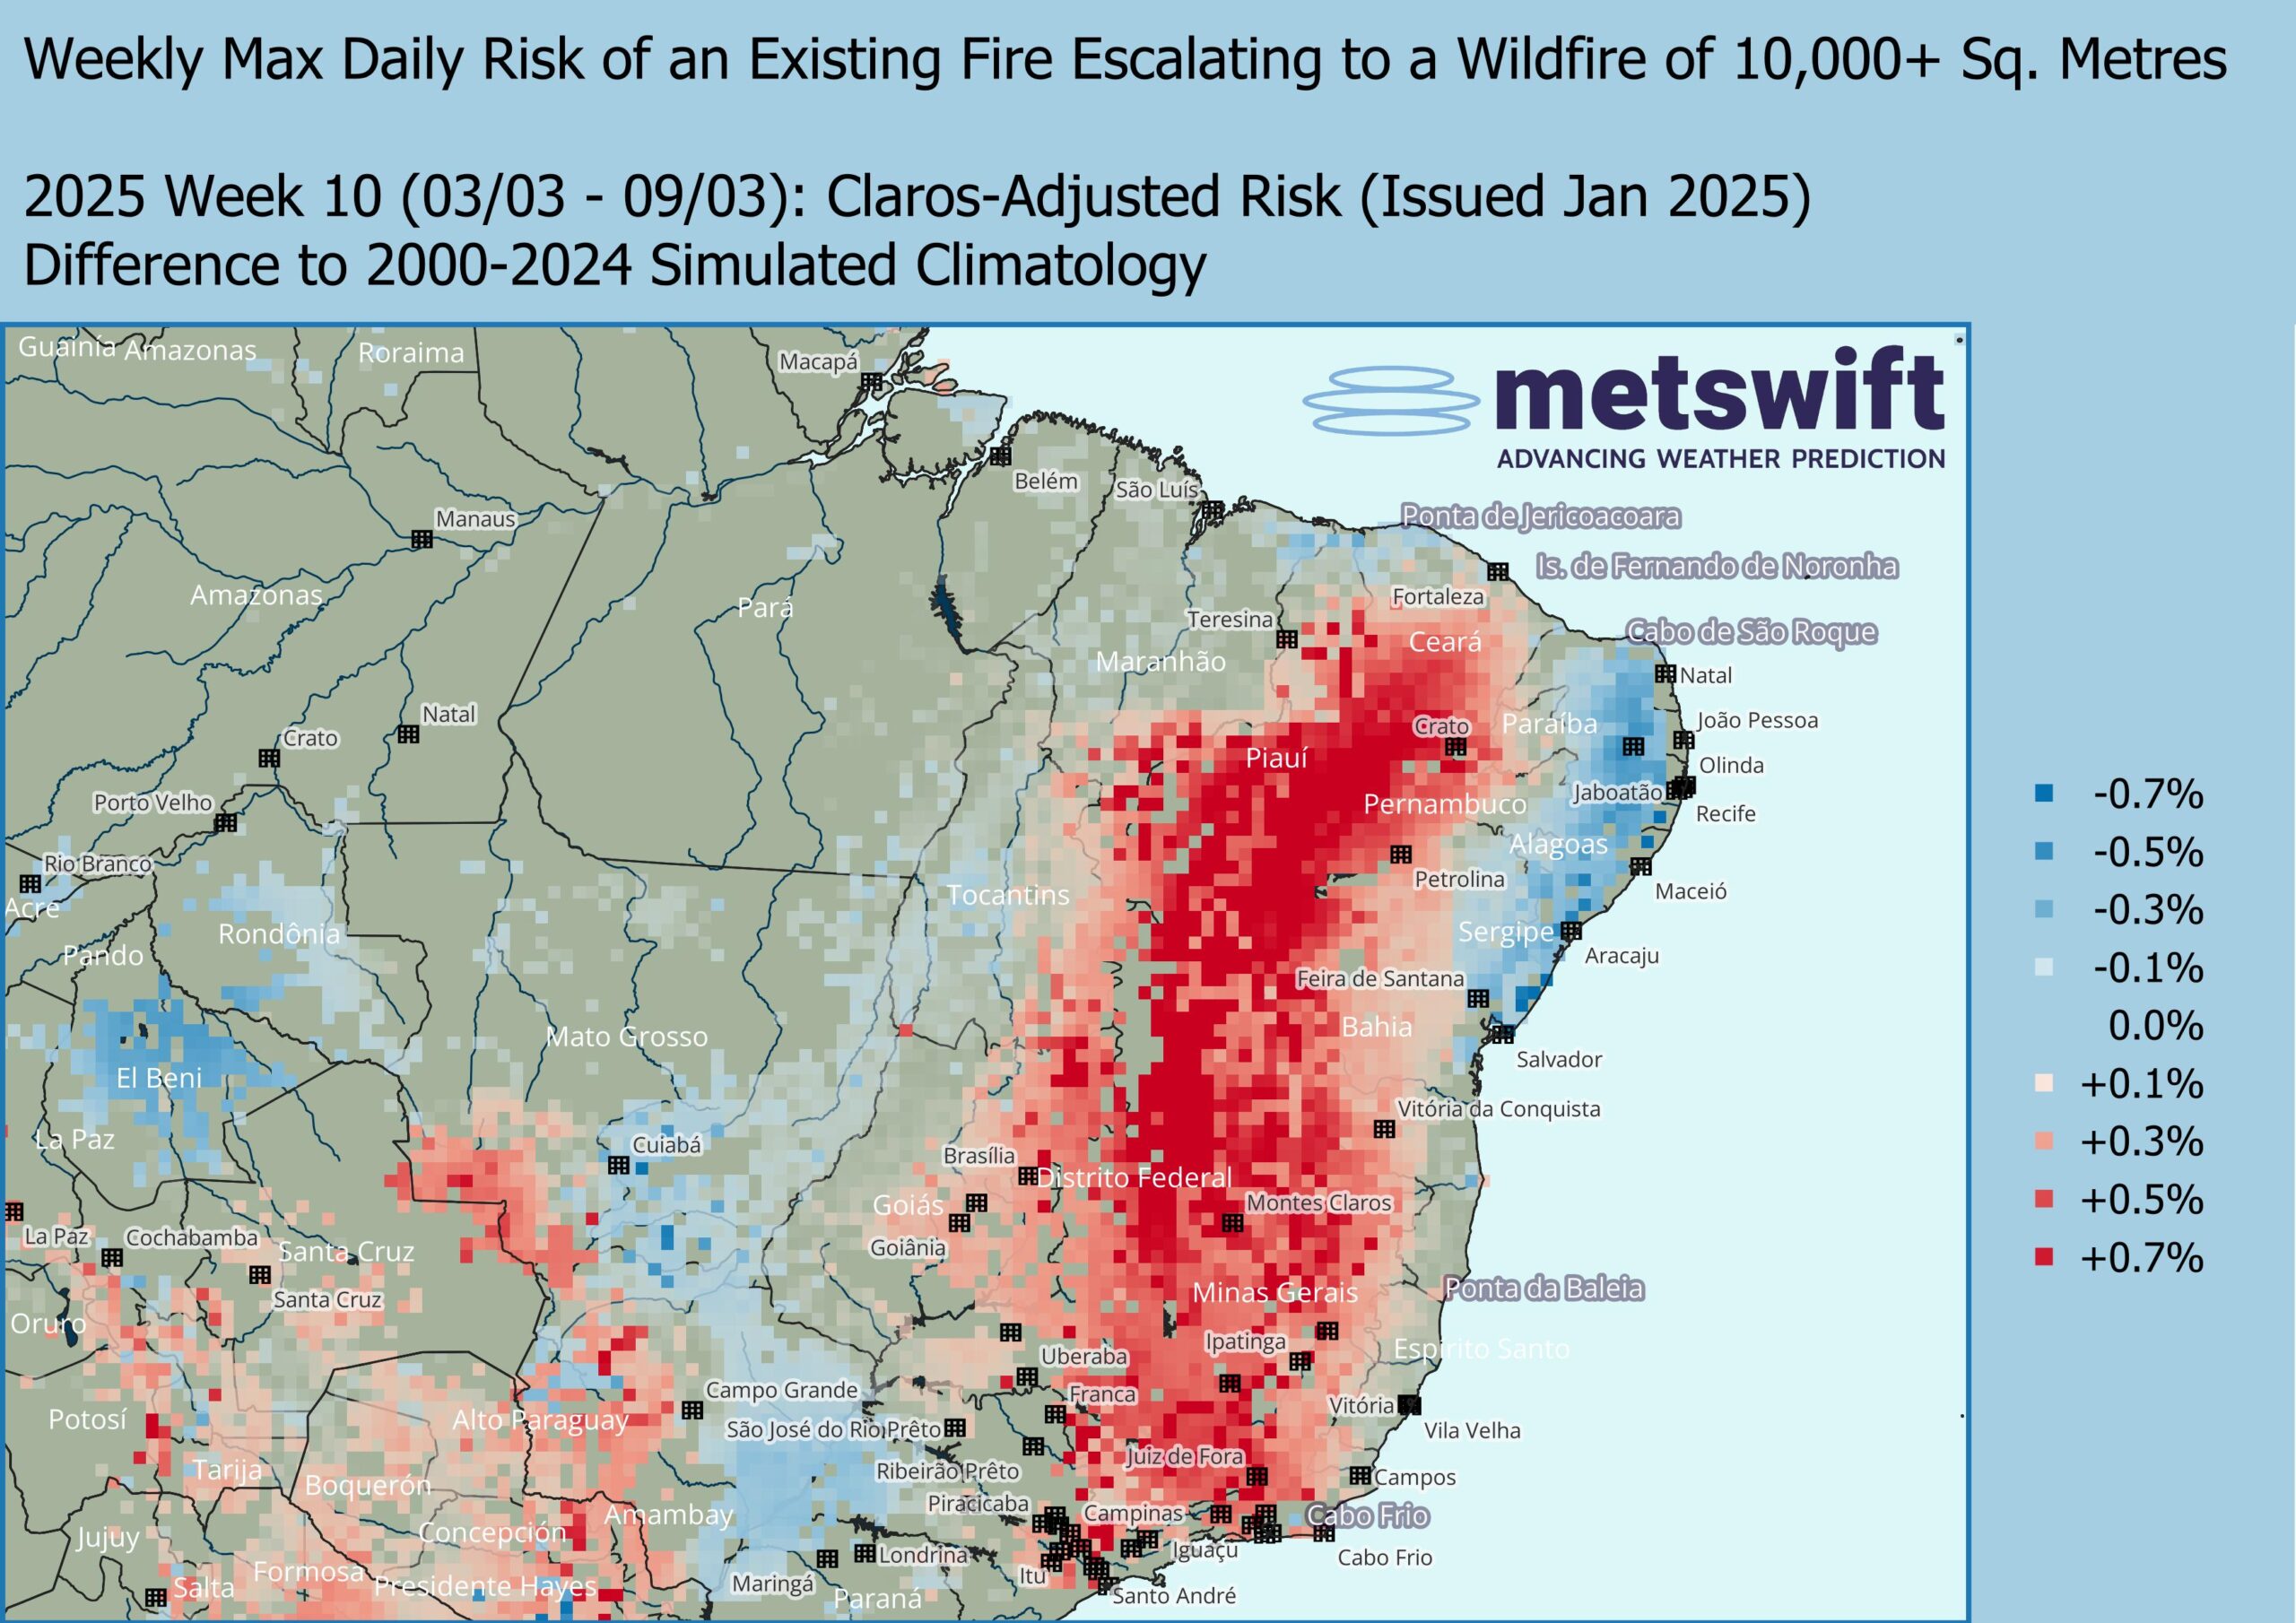
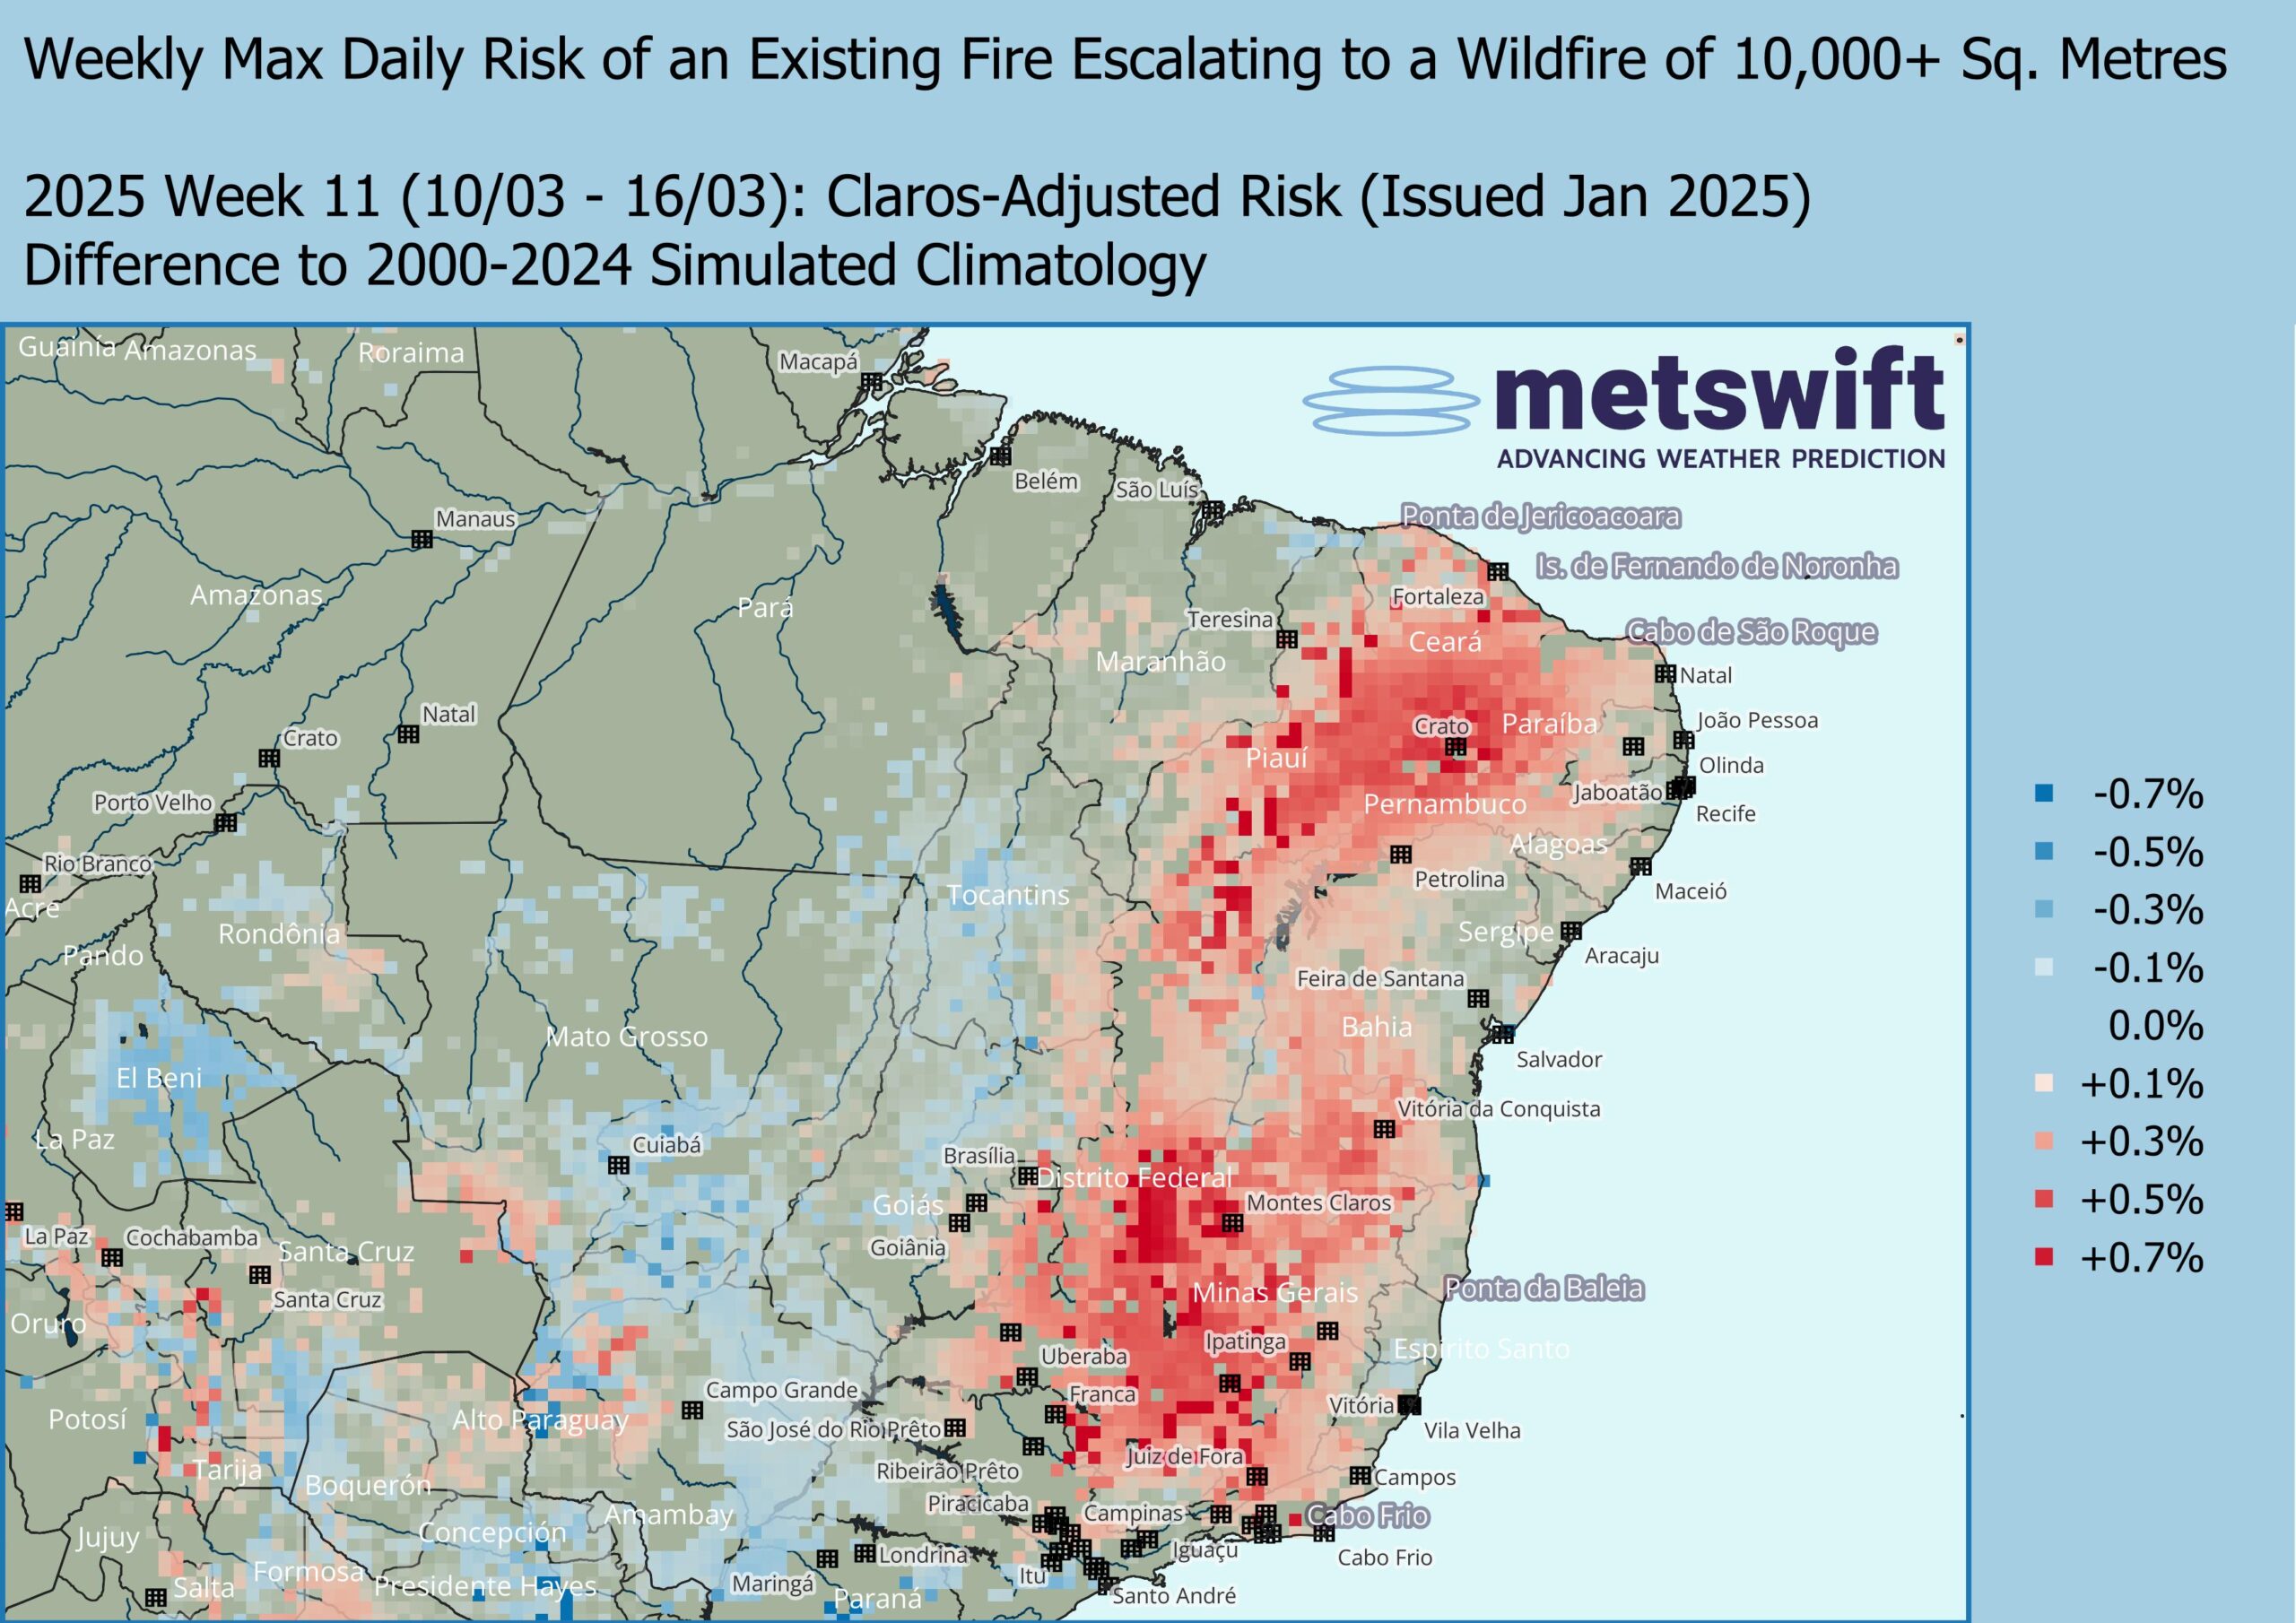
Importantly, the risk in the eastern region is more anomalously high, which tells us that normally, the risk isn’t on par with that of the area around Santa Cruz. Claros is suggesting widely higher than usual daytime temperatures for this time of year, but with near average rainfall around Santa Cruz, and mainly below average in eastern Brazil. The latter combination has a stronger drying effect on vegetation than higher temperatures alone, hence the larger increase in the risk of fires escalating to wildfires of at least 10 square km.
Late July in Central-Western Africa
Next, we’re turning our attention to the transition zone between the tropical and desert biomes of Africa.
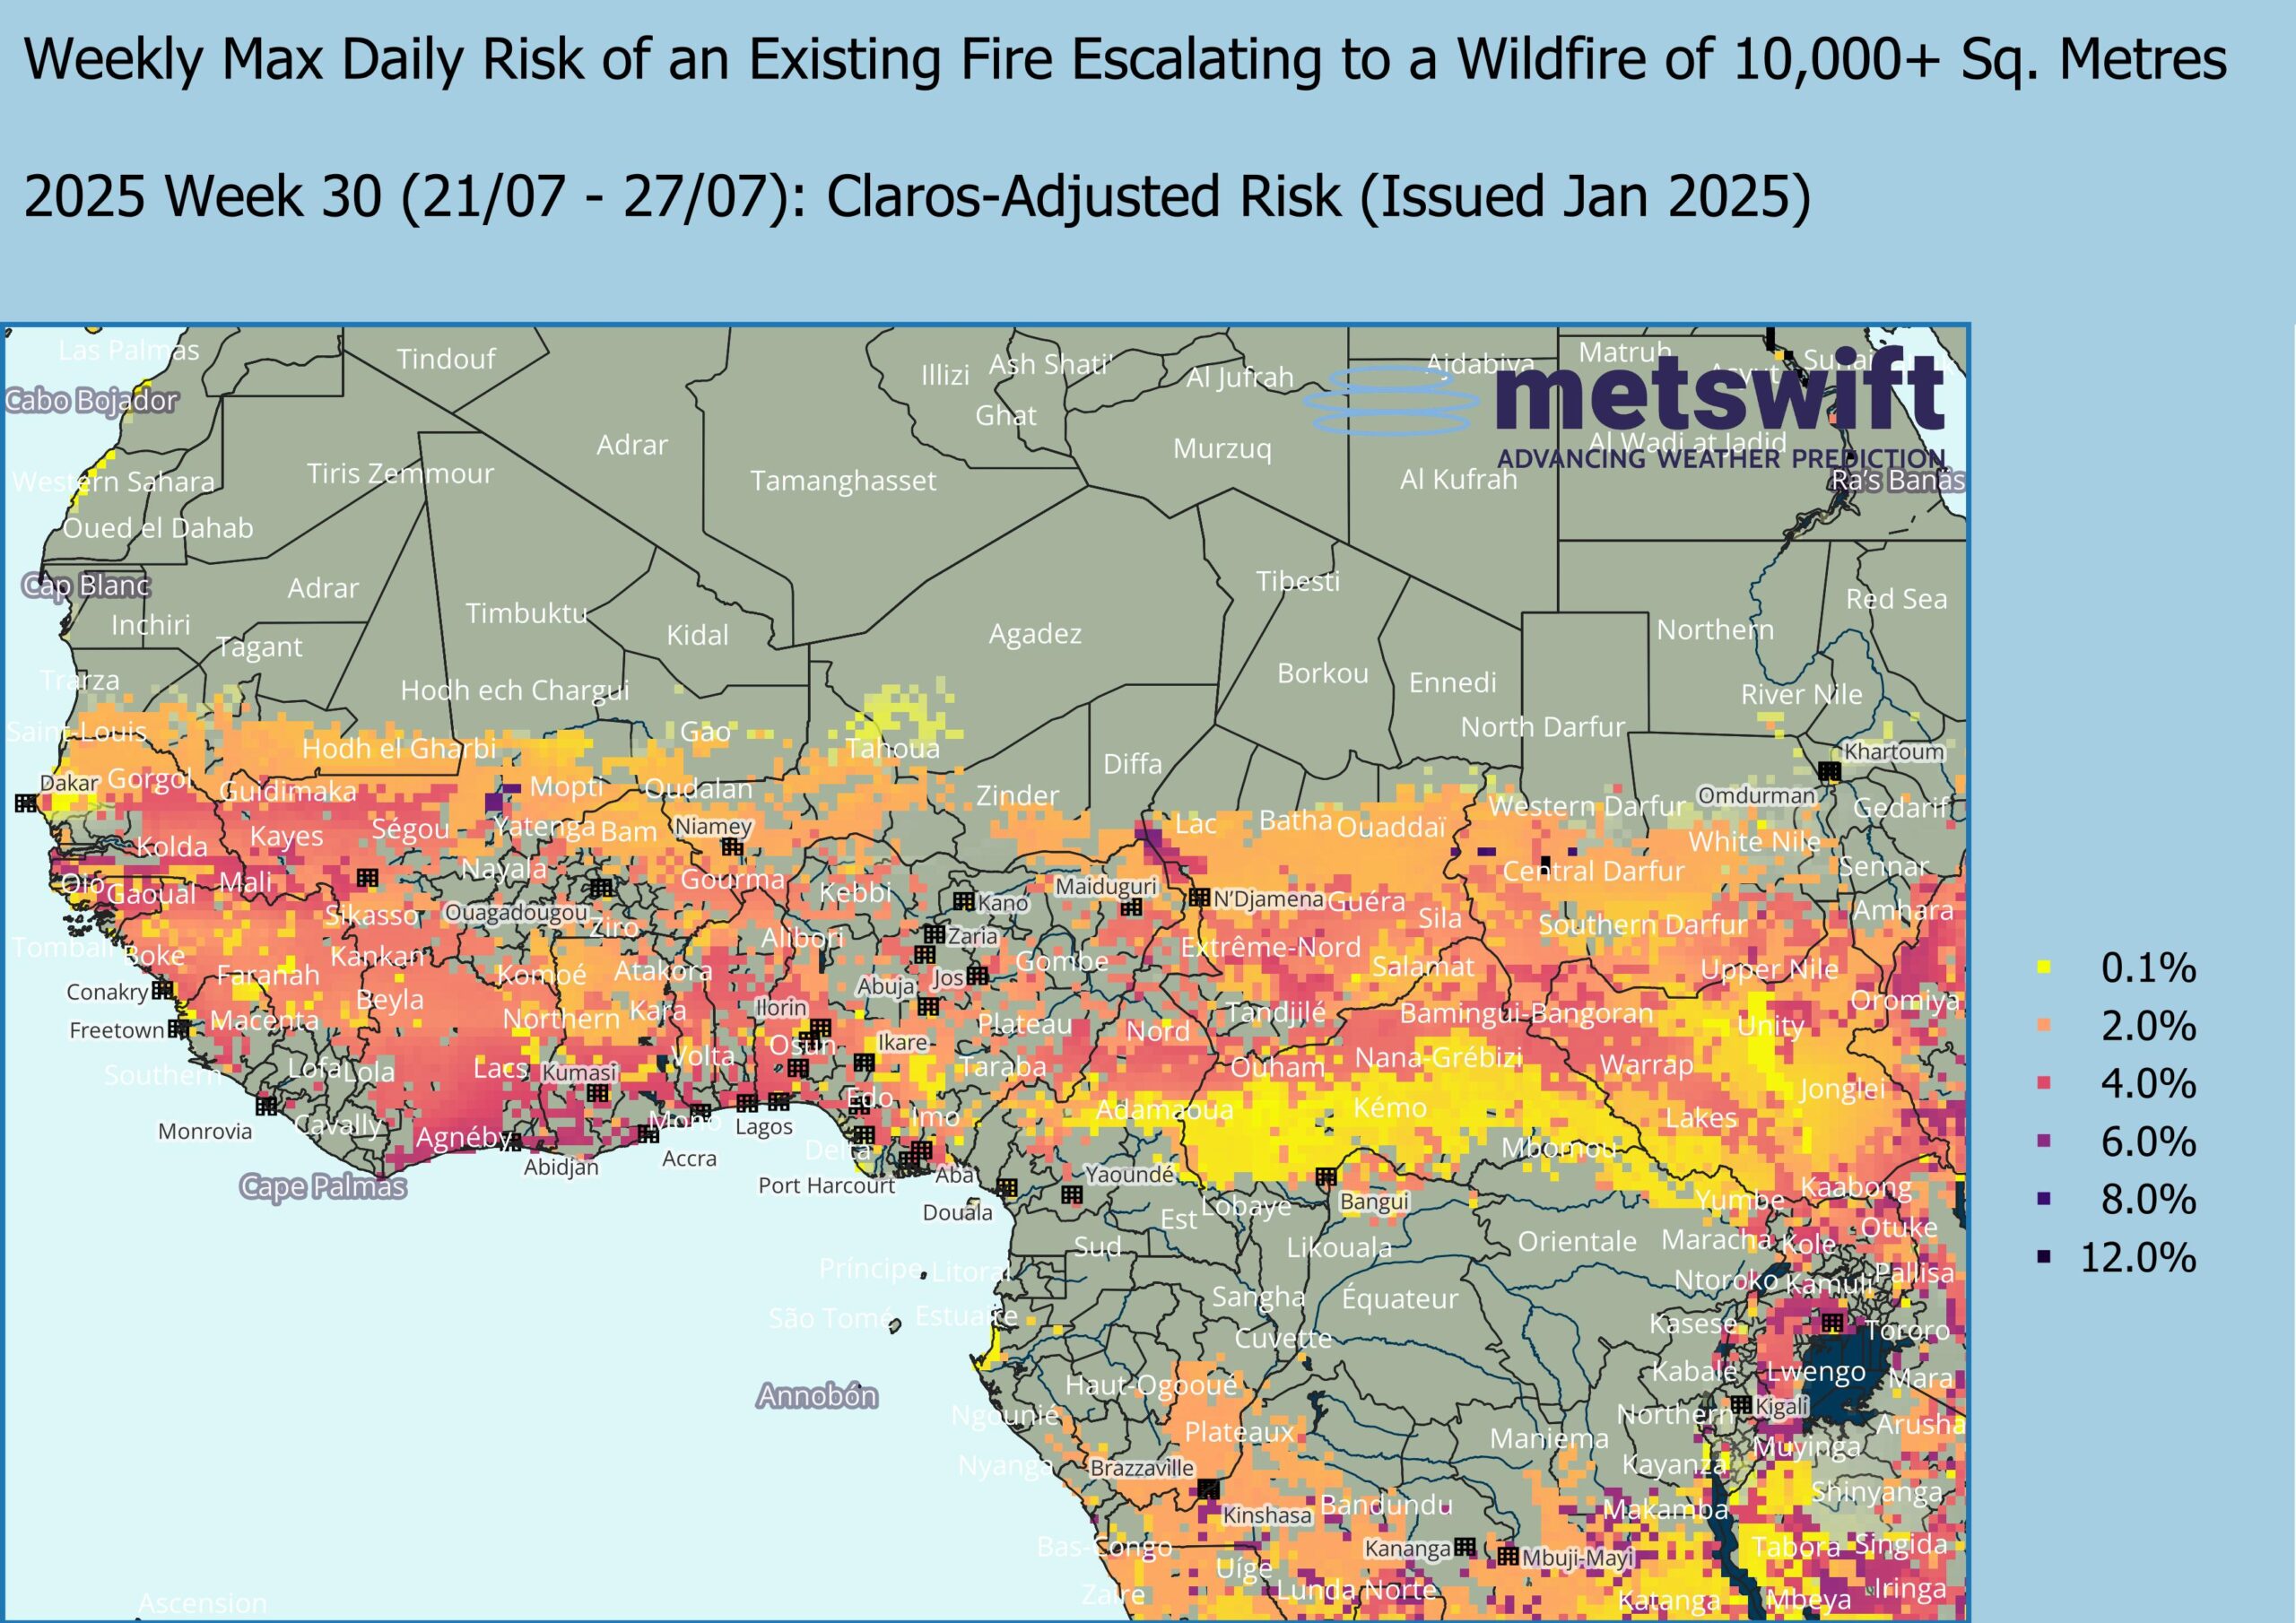
To those familiar with the sub-Saharan seasons, the timing may seem contradictory, as this is well into the rainy season. The key here is that the risk comes not from persistent dry weather, but the predominant nature of the rainfall: Intermittent and often thundery. The thunderstorms roll across vast swathes of forest, so whenever lightning strikes, there’s a distinct possibility of a spreading fire.
Often, rainfall leads to containment before long, but occasionally, the fires can reach at least 10 square km of coverage.
Claros suggests above normal daytime temperatures in late July 2025, raising the wildfire risk by up to 0.7%. That might not sound like much, but for many areas that’s proportionally 15-20% higher than climatology.
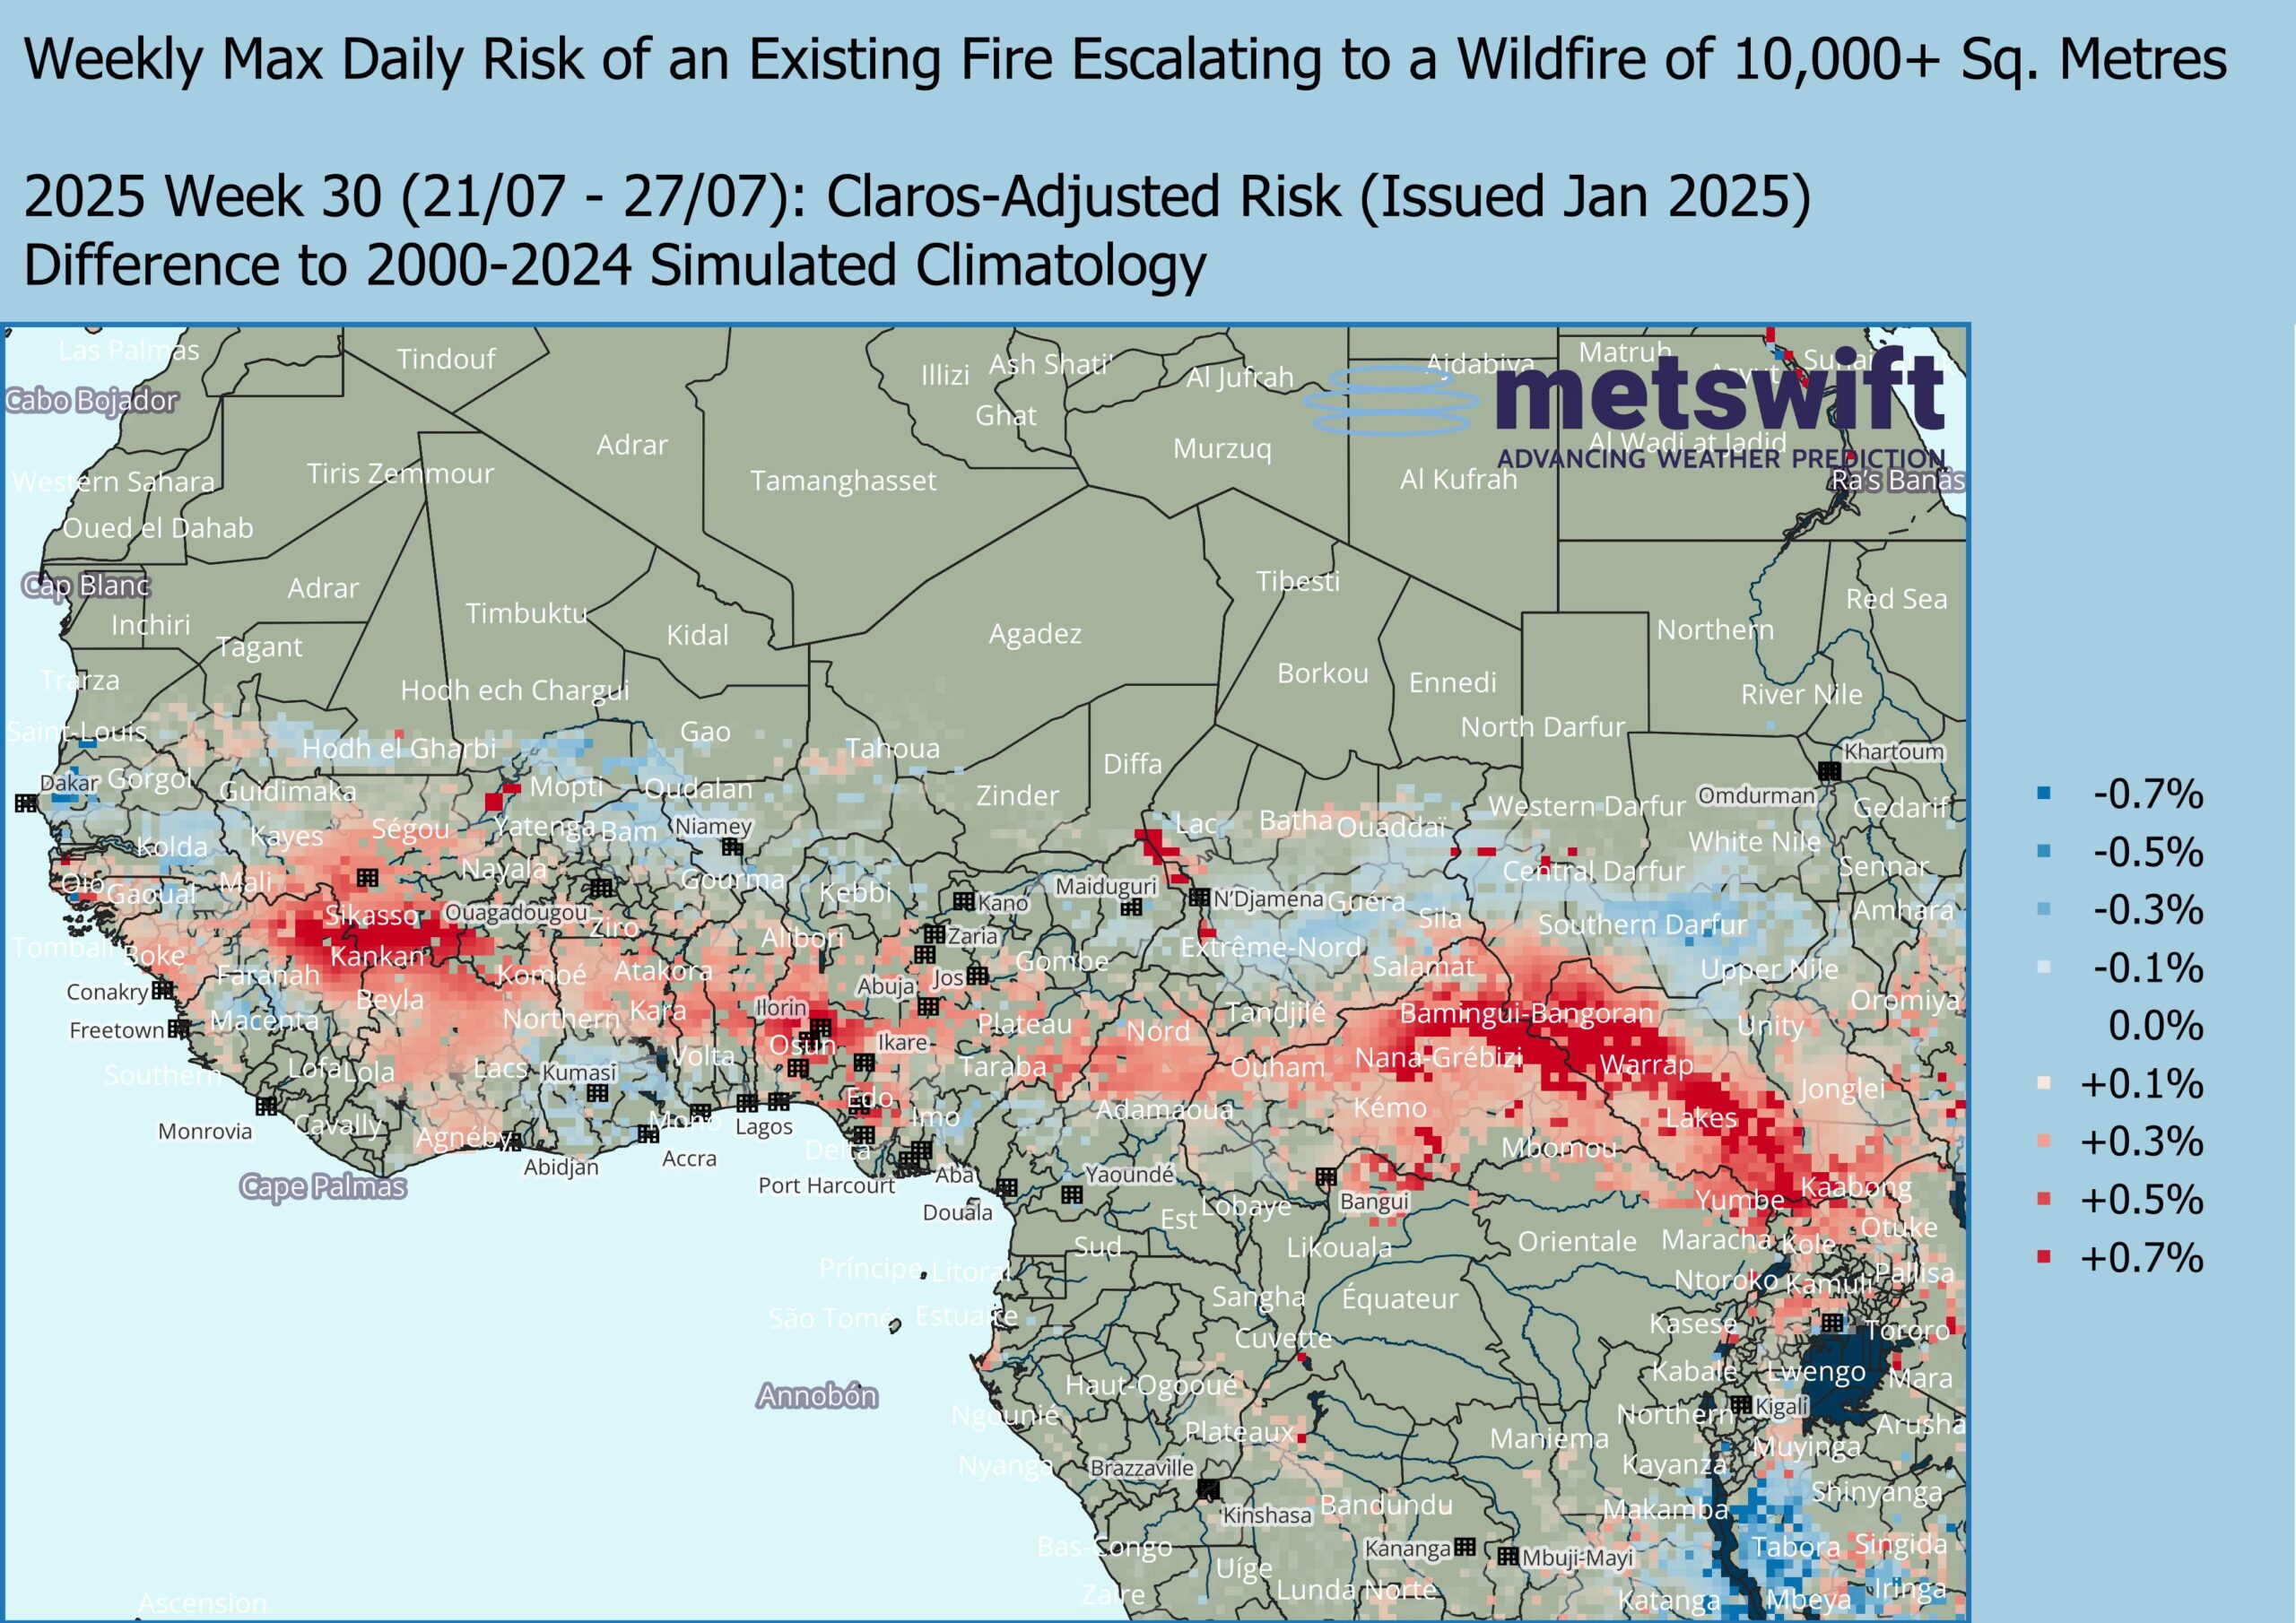
A time for the local population to be extra vigilant.
Finally, our gaze shifts to central-eastern Asia in late November, more specifically two areas: the wide swathe of herbaceous vegetation that stretches thousands of miles north-eastward from Tibet/Xizang, and the forests between Kunming and Guiyang.
Mid-November in Central-Eastern Asia
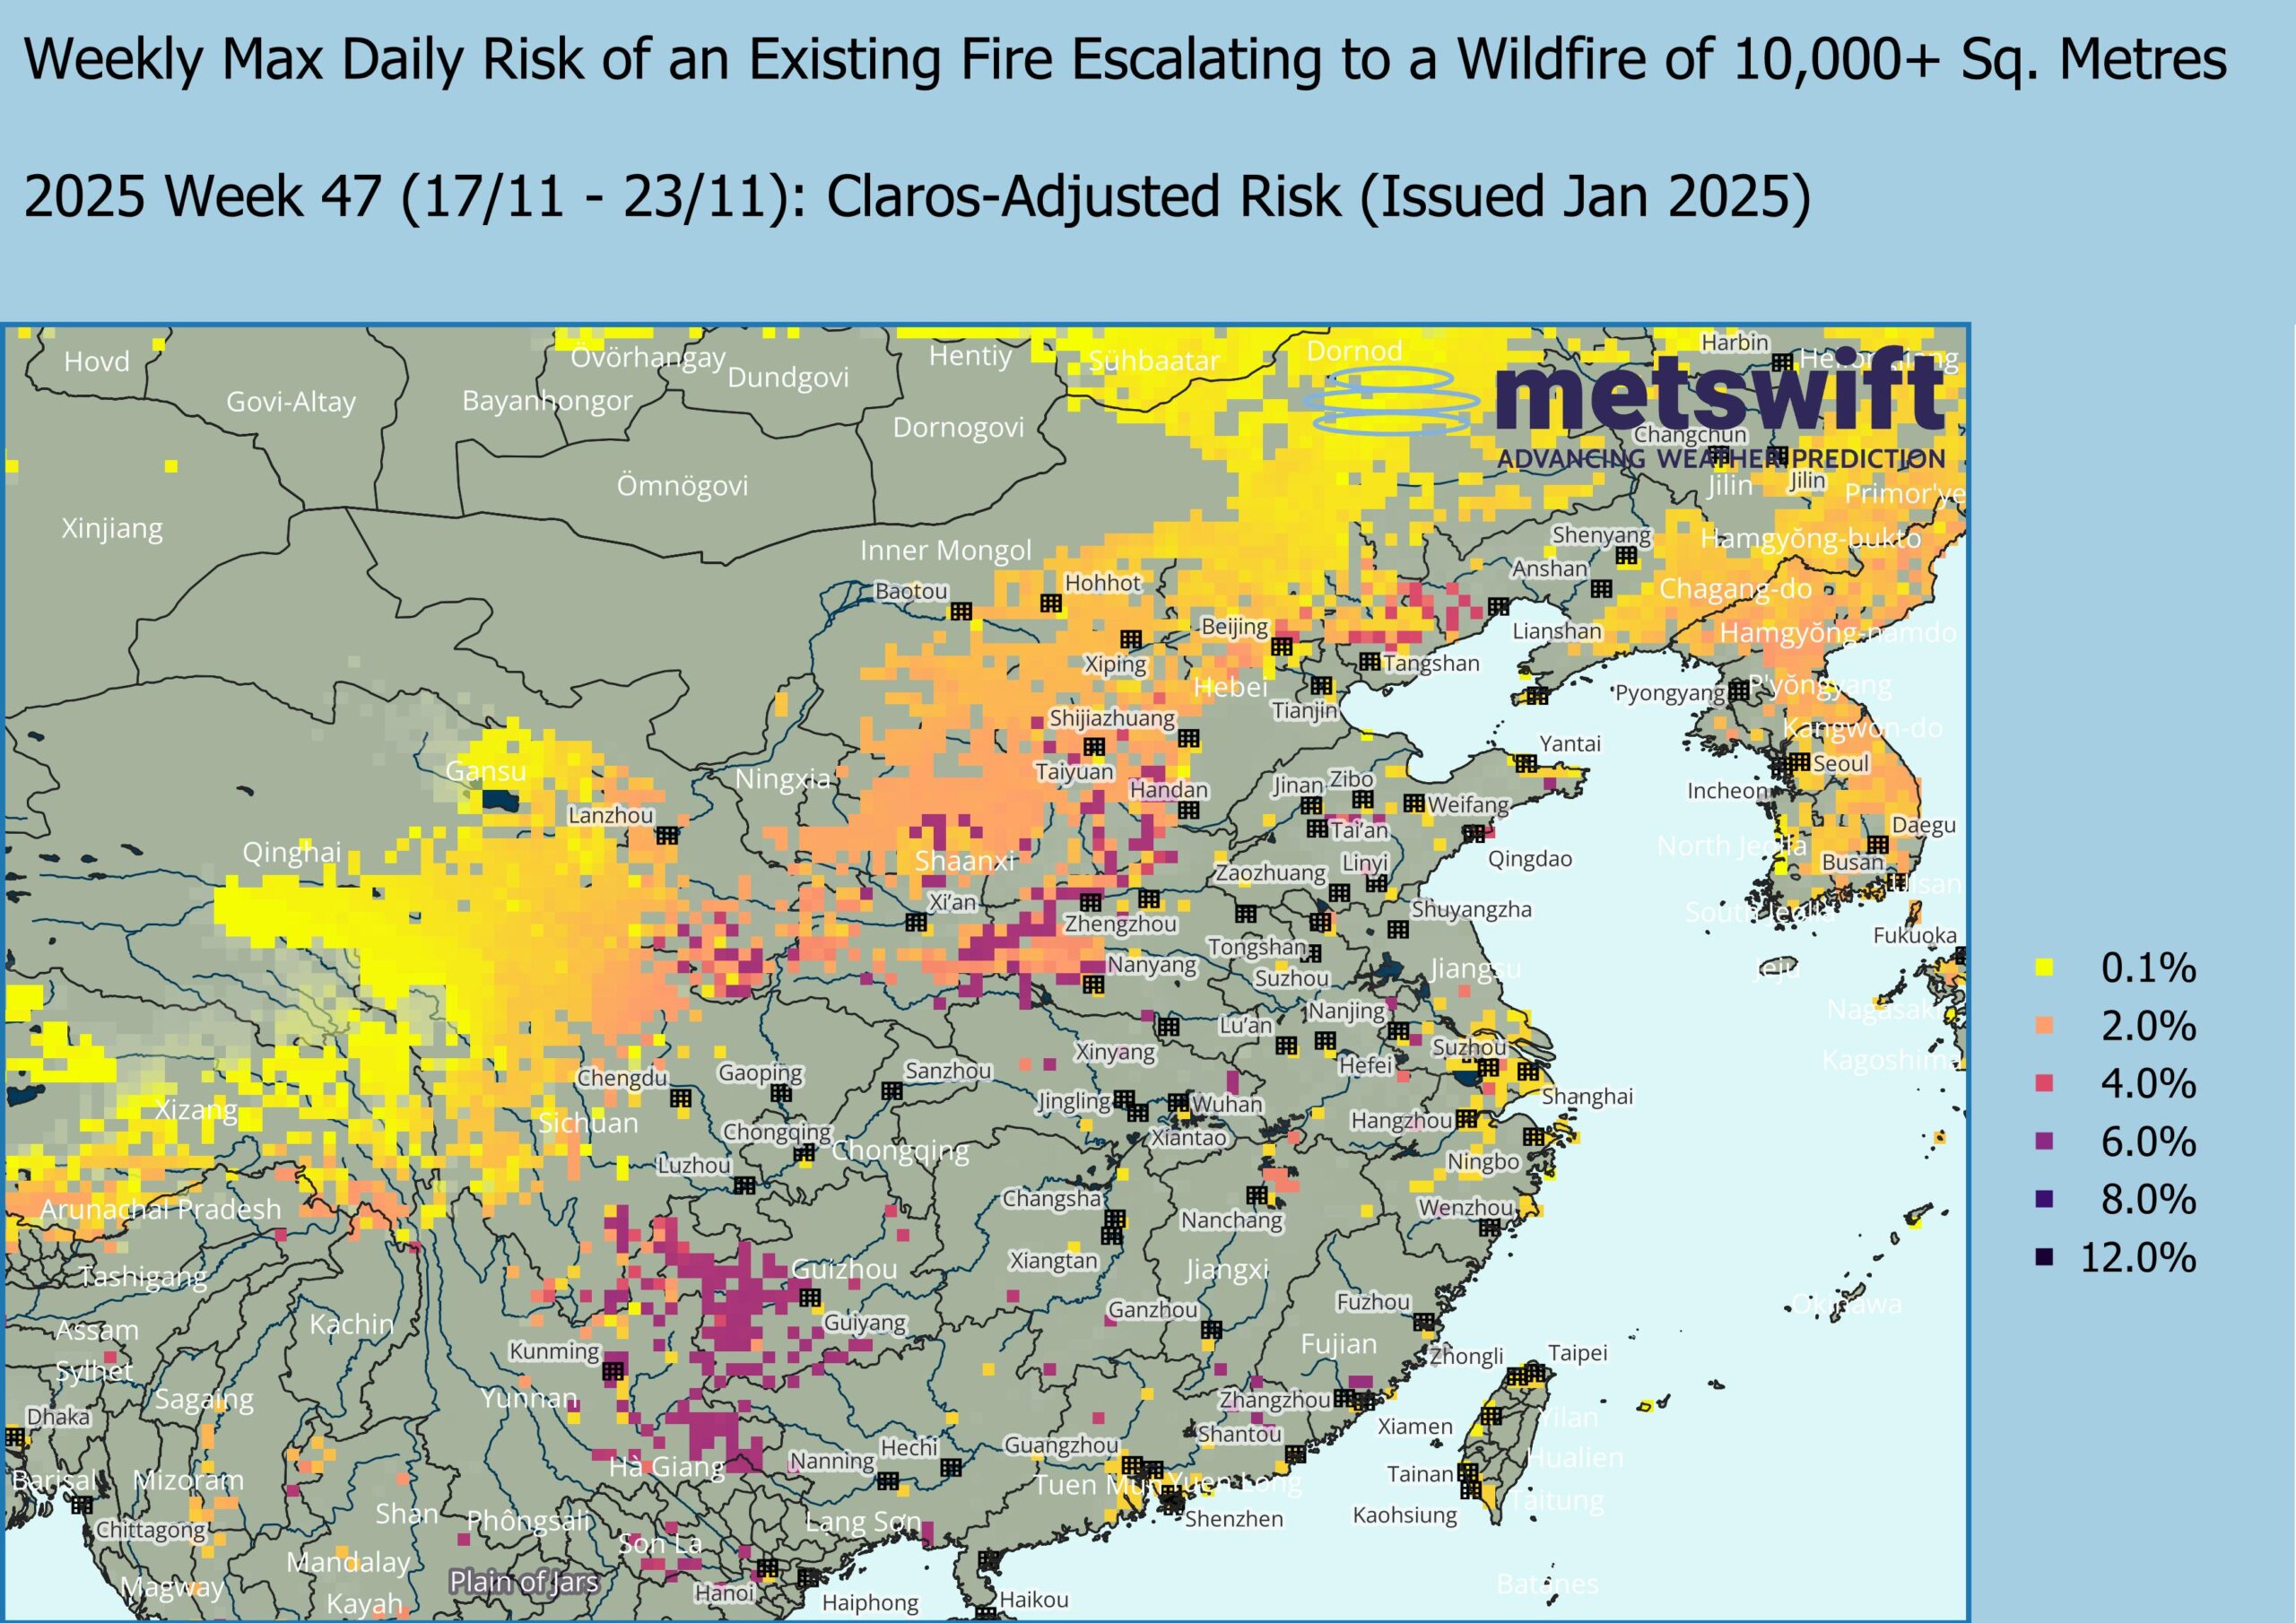
In the first of those regions, the predicted risk of fire escalation to at least 10 square km is mostly modest compared to others we’ve looked at in this blog, but 2-4% is not to be sniffed at, and locally it reaches up to 6%, which is on par with the second region.
Both are suggested to have an increased risk compared to climatology in mid-November 2025.
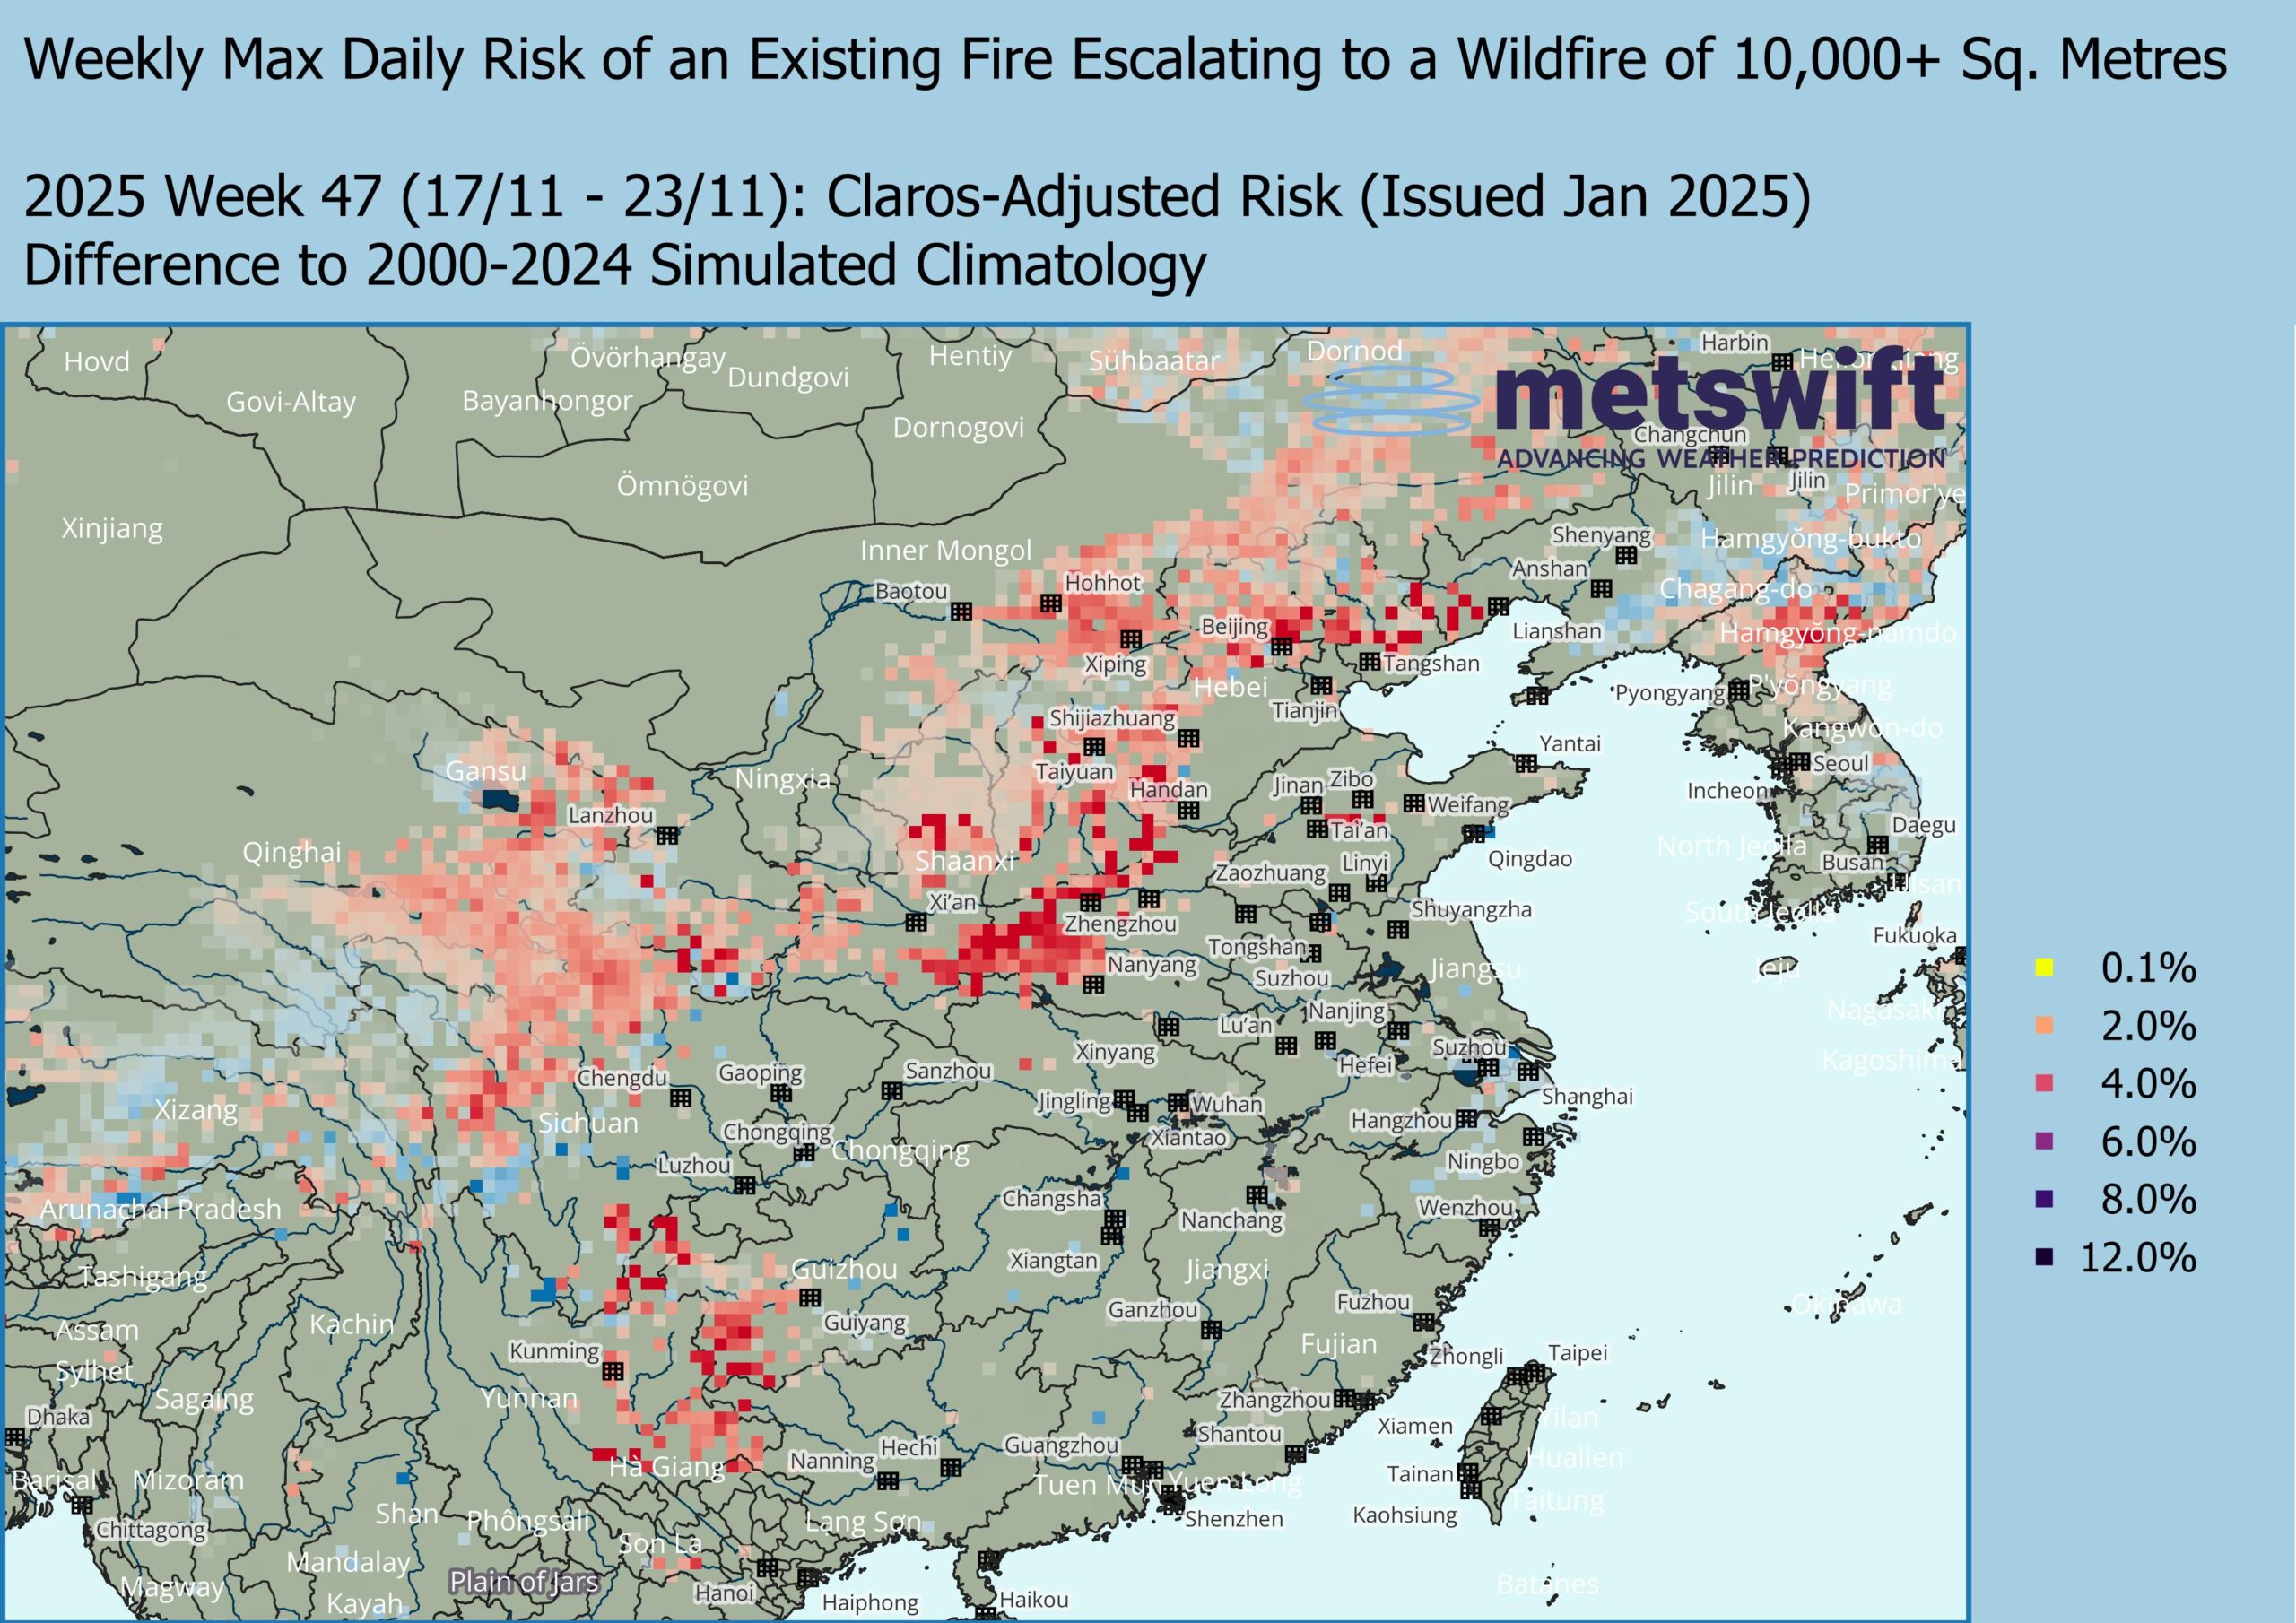
For this week of the year, Claros is suggesting a widespread combination of above normal temperatures and near to below normal precipitation, in some spots as little as 40% of the usual.
Though late in the year, anomalously warm and dry spells of weather can still have a considerable drying effect on vegetation even in the northern reaches of China. No wonder, then, that a higher than usual risk of wildfires is predicted.
Wholly Inclusive
As demonstrated with a few examples here, MetSwift’s wildfire model can be used to gain insights on wildfire risk for any land area in the world that isn’t permanently beneath ice.
This has been achieved by taking quality assured data from observed wildfires, where such data is available, and training the model to understand the relationship between the frequency of those fires, the terrain, and the weather conditions. This deep understanding has then been leveraged to map the risk globally based on those key factors.
Comparison with satellite estimated wildfire risk, while allowing for its inclusion of controlled burns and non-flaming heat sources, has confirmed that MetSwift’s model presents a realistic view of how the risk varies across the globe.
The final step has been to integrate the predictive power of MetSwift’s Claros model, for a non-static view of the risk based upon the most likely weather conditions out to 2 years ahead.
High Resolution
Each grid point of the model data covers on average a 28 by 28 km square (it varies with latitude and is largest at the equator). This helps capture relatively small-scale variations in terrain detail, improving the accuracy of localised assessments.
To use this to assess the risk of at least one wildfire within a region spanning multiple grid points, simply calculate the probability of every single point not seeing a wildfire, then subtract that from 100%.
For example, if your region had grid point risks of 1%, 4%, 3%, 6%, then the risk of at least one wildfire is 100% – (99% * 96% * 97% * 94%) = 13.34%.
Note how much larger that risk is than the highest grid point risk. It follows that even a slight difference in predicted risk compared to climatology can amount to a substantial change when making regional assessments.
James Peacock MSc
Head Meteorologist at MetSwift
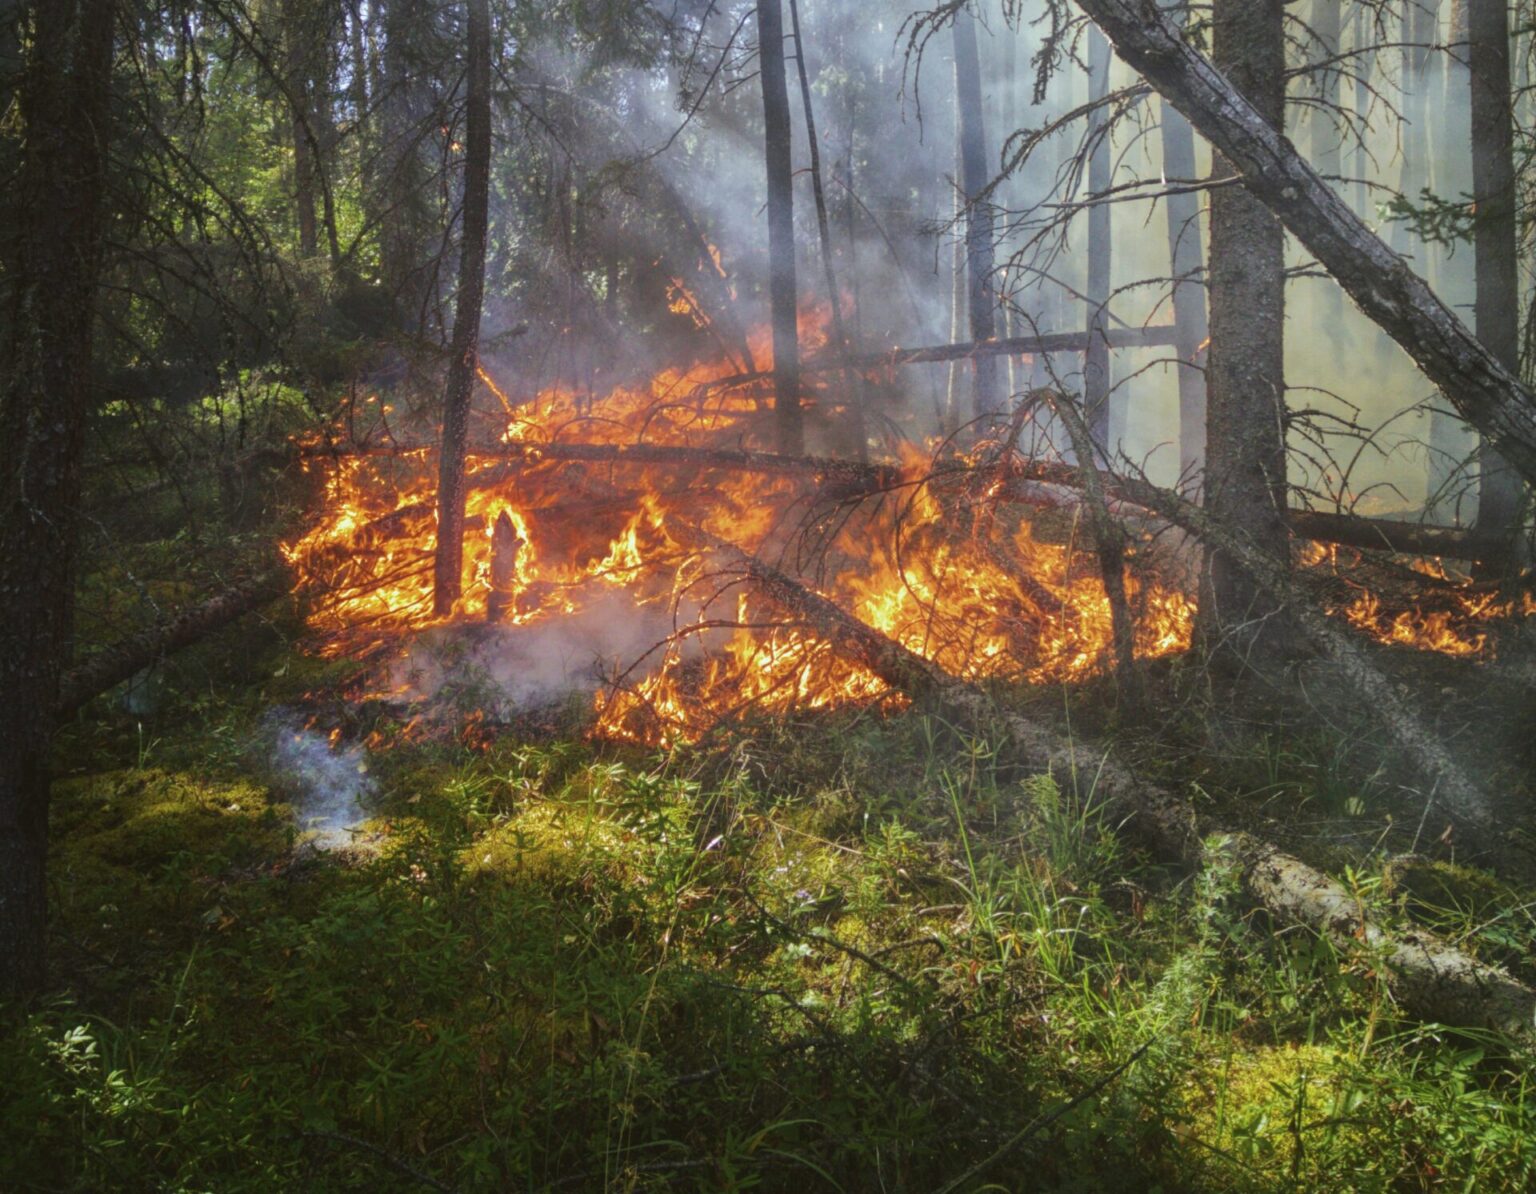
Featured photo by Landon Parenteau on Unsplash