
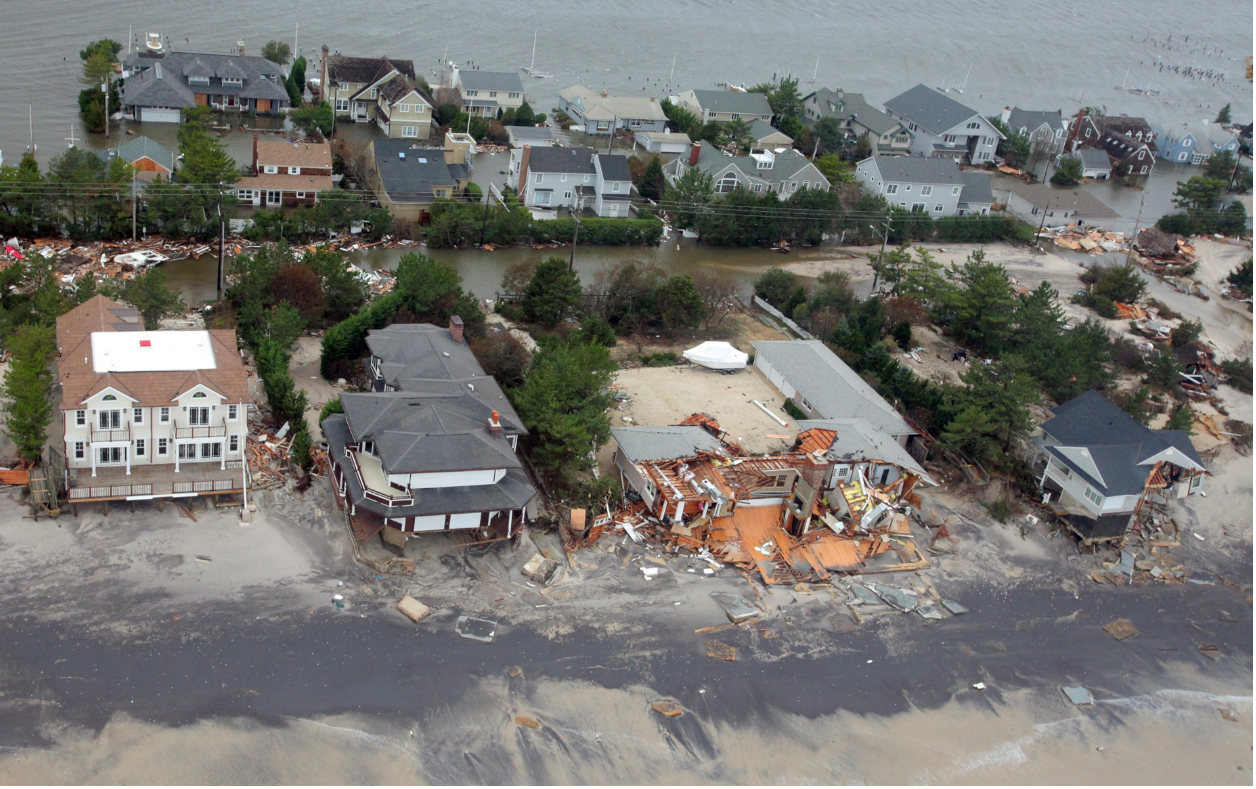
Between 1970 and 2021, improvements in early warning systems and coordinated disaster management have phenomenally reduced global human casualties from natural disasters. But the same can’t be said for economic losses, which were 8 times higher in 2010-2019 versus 1970-1979, according to new figures from the World Meteorological Organisation (WMO).
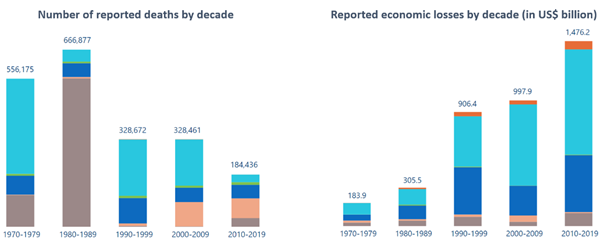
As immense as the nearly US $1.5 trillion of losses for 2010-2019 is, the true figure may well be even higher, as only 37% of all weather, climate, and water-related disasters have been reported.
The startling increase across the past half-century has connections to both general increases in developed land coverage and regional climate trends.
Sadly, relative to the sizes of their economies, developing countries have suffered the largest proportional losses. Even when early warning systems enable large-scale evacuations to save tens of thousands of lives, the poorest communities can be subject to crippling losses, as recently seen with extremely severe cyclonic storm Mocha in Bangladesh and Myanmar. You can move the people, but not their homes.
Other recent standout tropical cyclone impacts include Cyclone Idai’s impacts on Mozambique in March 2019, which was the costliest event on record for Africa (US $2.1 billion), and the devastating impacts of Hurricane Maria on Puerto Rico in 2017, which accounts for 93% of its losses across all of 1970-2021.
Meanwhile, flooding has caused staggering losses in some countries, such as an unprecedented US $40 billion in Germany during July 2021. At the other end of the scale, severe droughts have also hit hard, such as in Ethiopia during 2015 (US $1.5 billion losses).
Based on the Centre for Research on the Epidemiology of Disasters’ (CRED) Emergency Events Database (EM-DAT), the increasing trend to loses continued through 2020-2021. Concerningly, this was primarily attributed to higher intensity storms.
Of 17 categorised disaster types, tropical cyclones and floods account for a combined 70% of reported global economic losses. That’s ten times that of the next largest contributor (drought; 7%).

Notably, this is the case despite tropical cyclones making up just 17% of the reported disasters and floods a mere 8%. This is testament to them having a relatively large scale of impact without being rare events (globally speaking); each year brings dozens of tropical cyclone landfalls and severe flooding events – sometimes interconnected.
Worldwide, MetSwift’s proprietary platform enables postcode-specific risk analysis for a variety of natural catastrophe and weather types, at a high time resolution (weekly and daily, respectively). Drawing upon historical event data including, for example, over 6,000 tropical cyclones since 1950, there is a highly credible bases for the percentage chance of, say, a hurricane striking the Florida Keys in the 2nd week of October.

What’s more, for severe weather events such as high daily rainfall, cutting-edge research allows us to identify the most useful information within the historical data and provide skilfully adjusted risks of occurrence. Which is to say, such events are anticipated more often when using MetSwift’s model, as opposed to the long-term climate normal.
To the left, regional hit rate* results are shown for the occurrence of rainfall, from testing our model across predictions initialised in each of Mar, Jun, Sep, and Dec, of each year 2010-2019.
The % changes are in comparison to using all historical data without any of the research applied, i.e. the long-term normal.
Evidently, there is a substantial net improvement in severe weather event prediction.
Importantly, these net gains are present for every region. Wherever one or two measures have changed undesirably, the loss is far outweighed by improvements to the others.
MetSwift are also developing a predictive model for tropical cyclones which, despite being in its early stages, has already demonstrated a level of skill at or above that of the top performing forecasts released by institutions such as Colorado State University (CSU).
Its accuracy for the 2022 Atlantic hurricane season (spanning Jun-Nov) was 2nd only to CSU for the (preceding) December issued forecasts and exceeded that of all but one forecast issued during the subsequent 8 months. Read more about that here.
When tested across the seasons of 2010-2022 with respect to the total number of hurricanes, MetSwift’s predictions issued the preceding December proved more accurate than any other prediction issued sooner than May. This, despite being at the joint-longest lead time with Tropical Storm Risk (TSR).

Similar success has also been seen when predicting for other basins, such as the West Pacific.
The model is also showing great promise for predicting where tropical cyclones are more or less likely to occur compared to long-term averages. Tested across 2005-2019, 70% of locations affected by a tropical storm or stronger cyclone were given an above normal risk by the model, while 60% of locations not affected were given a below normal risk.
MetSwift gives you the insight to mitigate the economic costs of severe weather and natural catastrophes.
James Peacock MSc
Head Meteorologist at MetSwift


